TCD1304-based spectrometer - Part 3
In this video I continue the work on my custom-made TCD1304-based spectrometer. In the previous 2 videos (Part 1 and Part 2) I showed the proof of concept and then I did some measurements on different LED as well as designed a PCB for the TCD1304 which fits the enclosure of the optics perfectly.
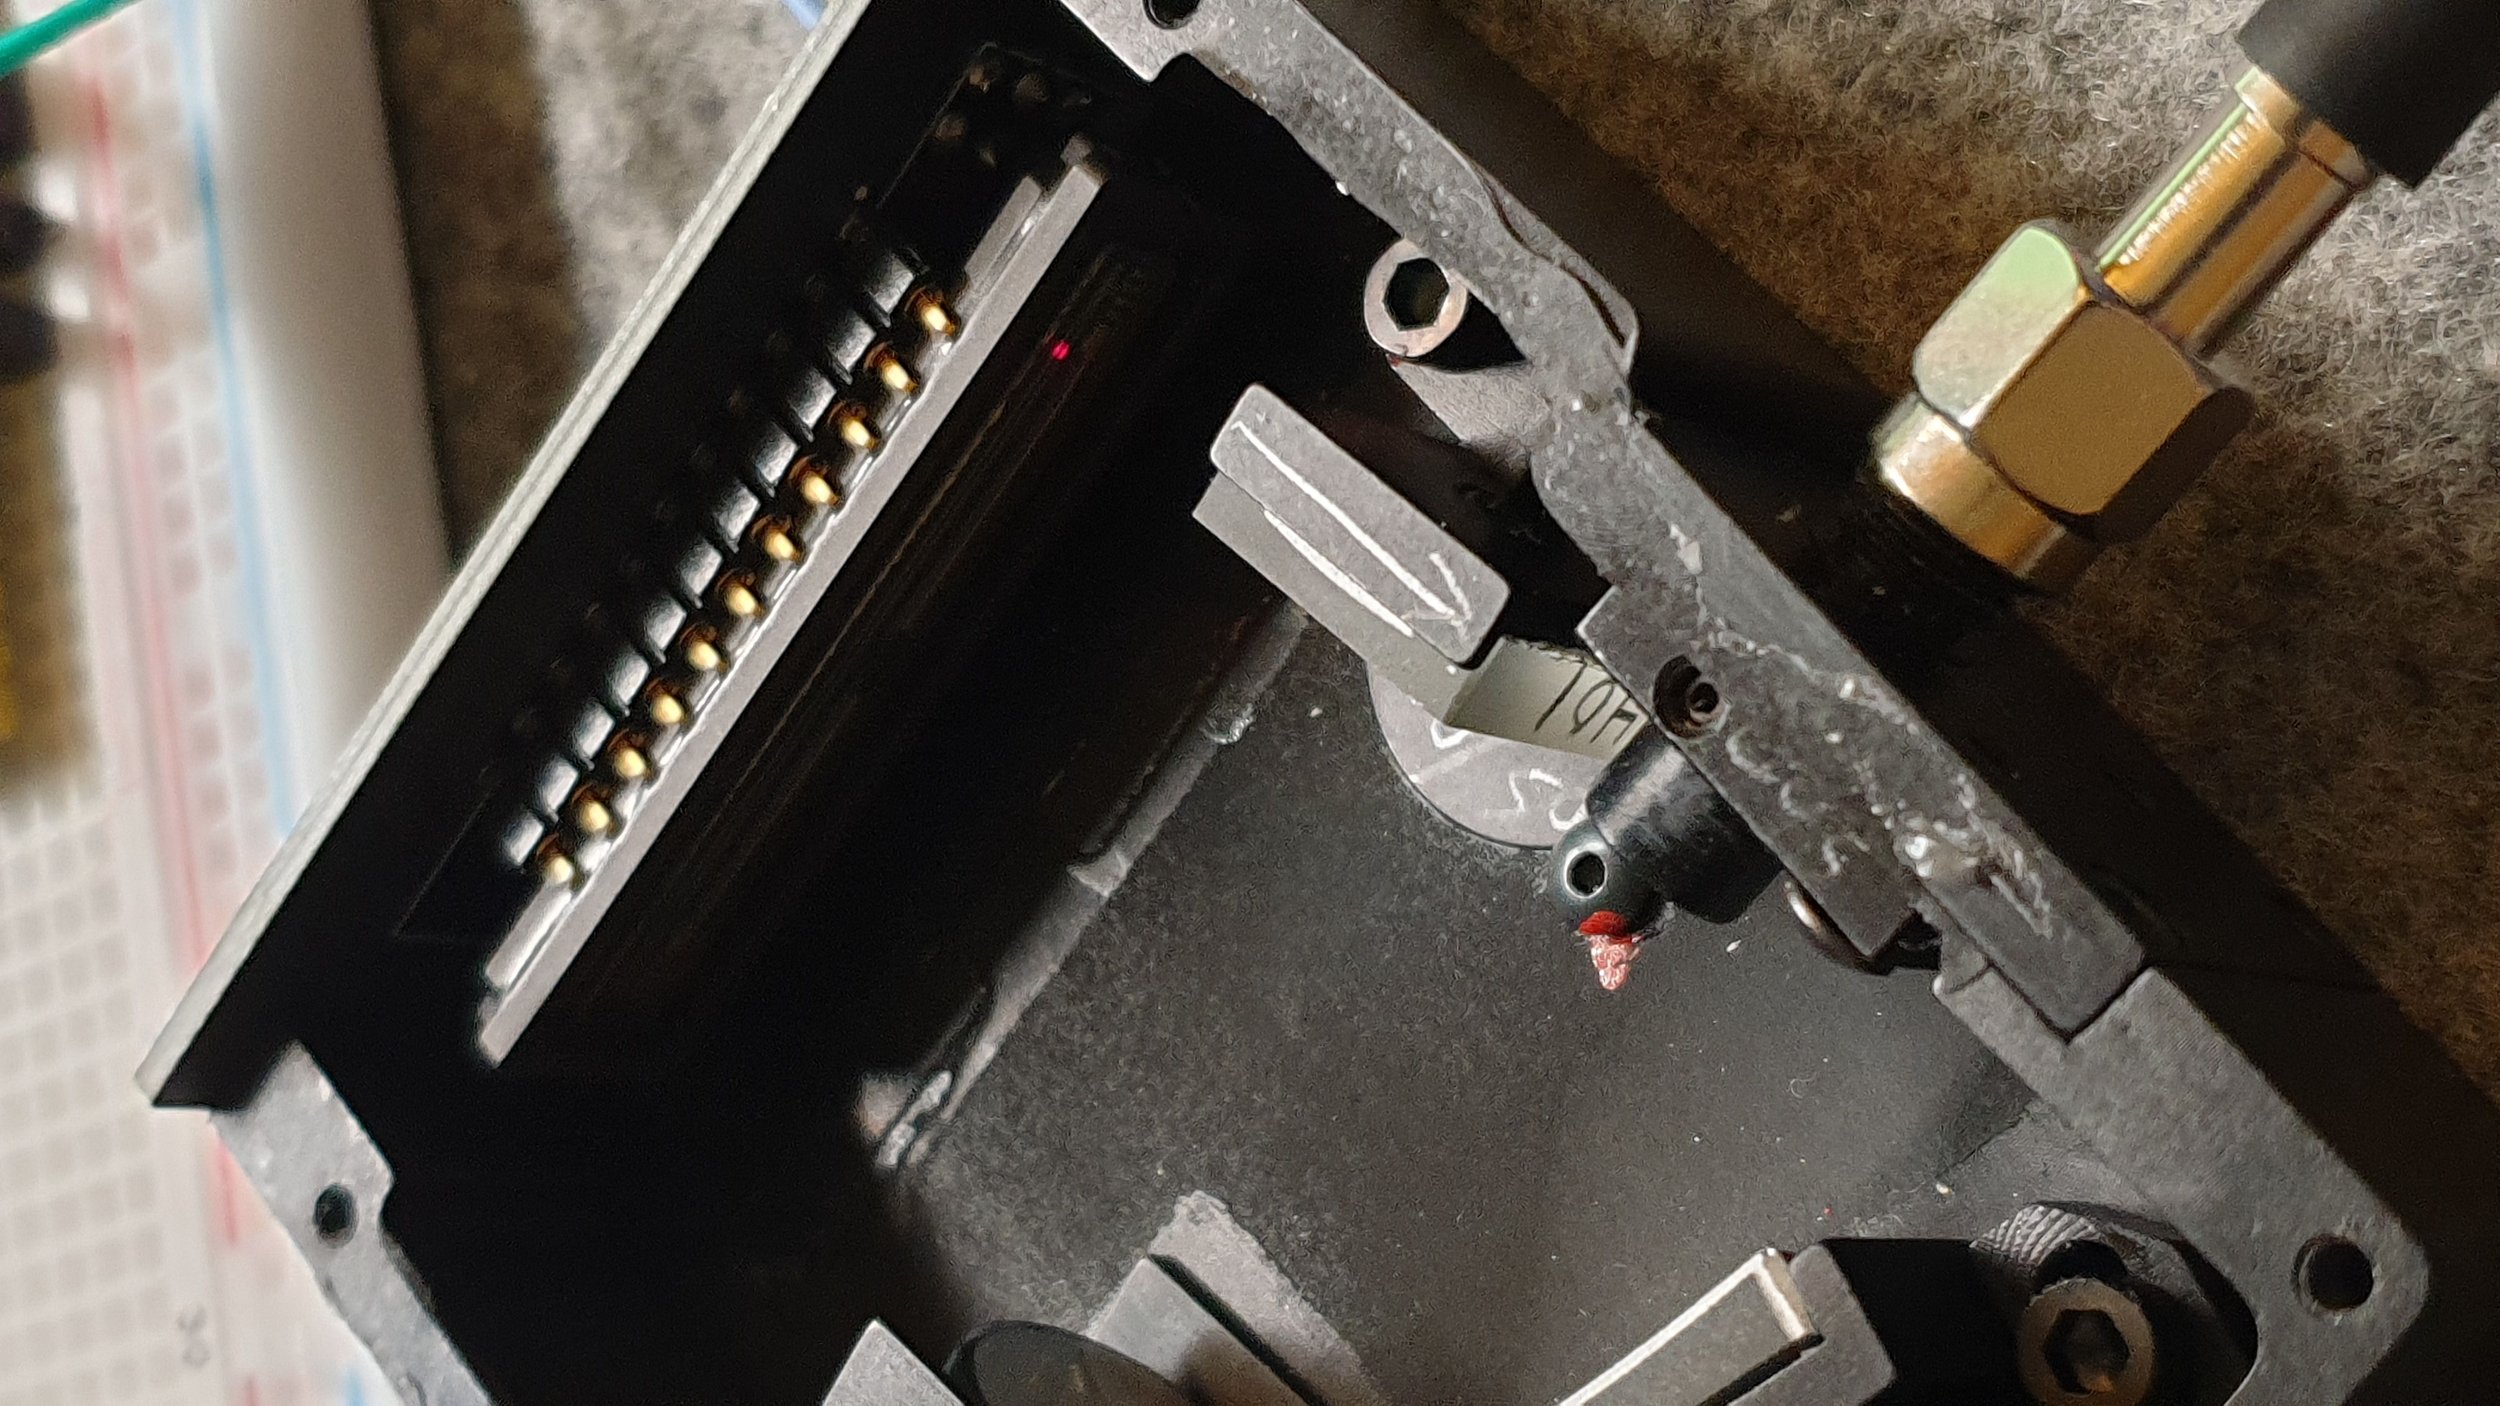
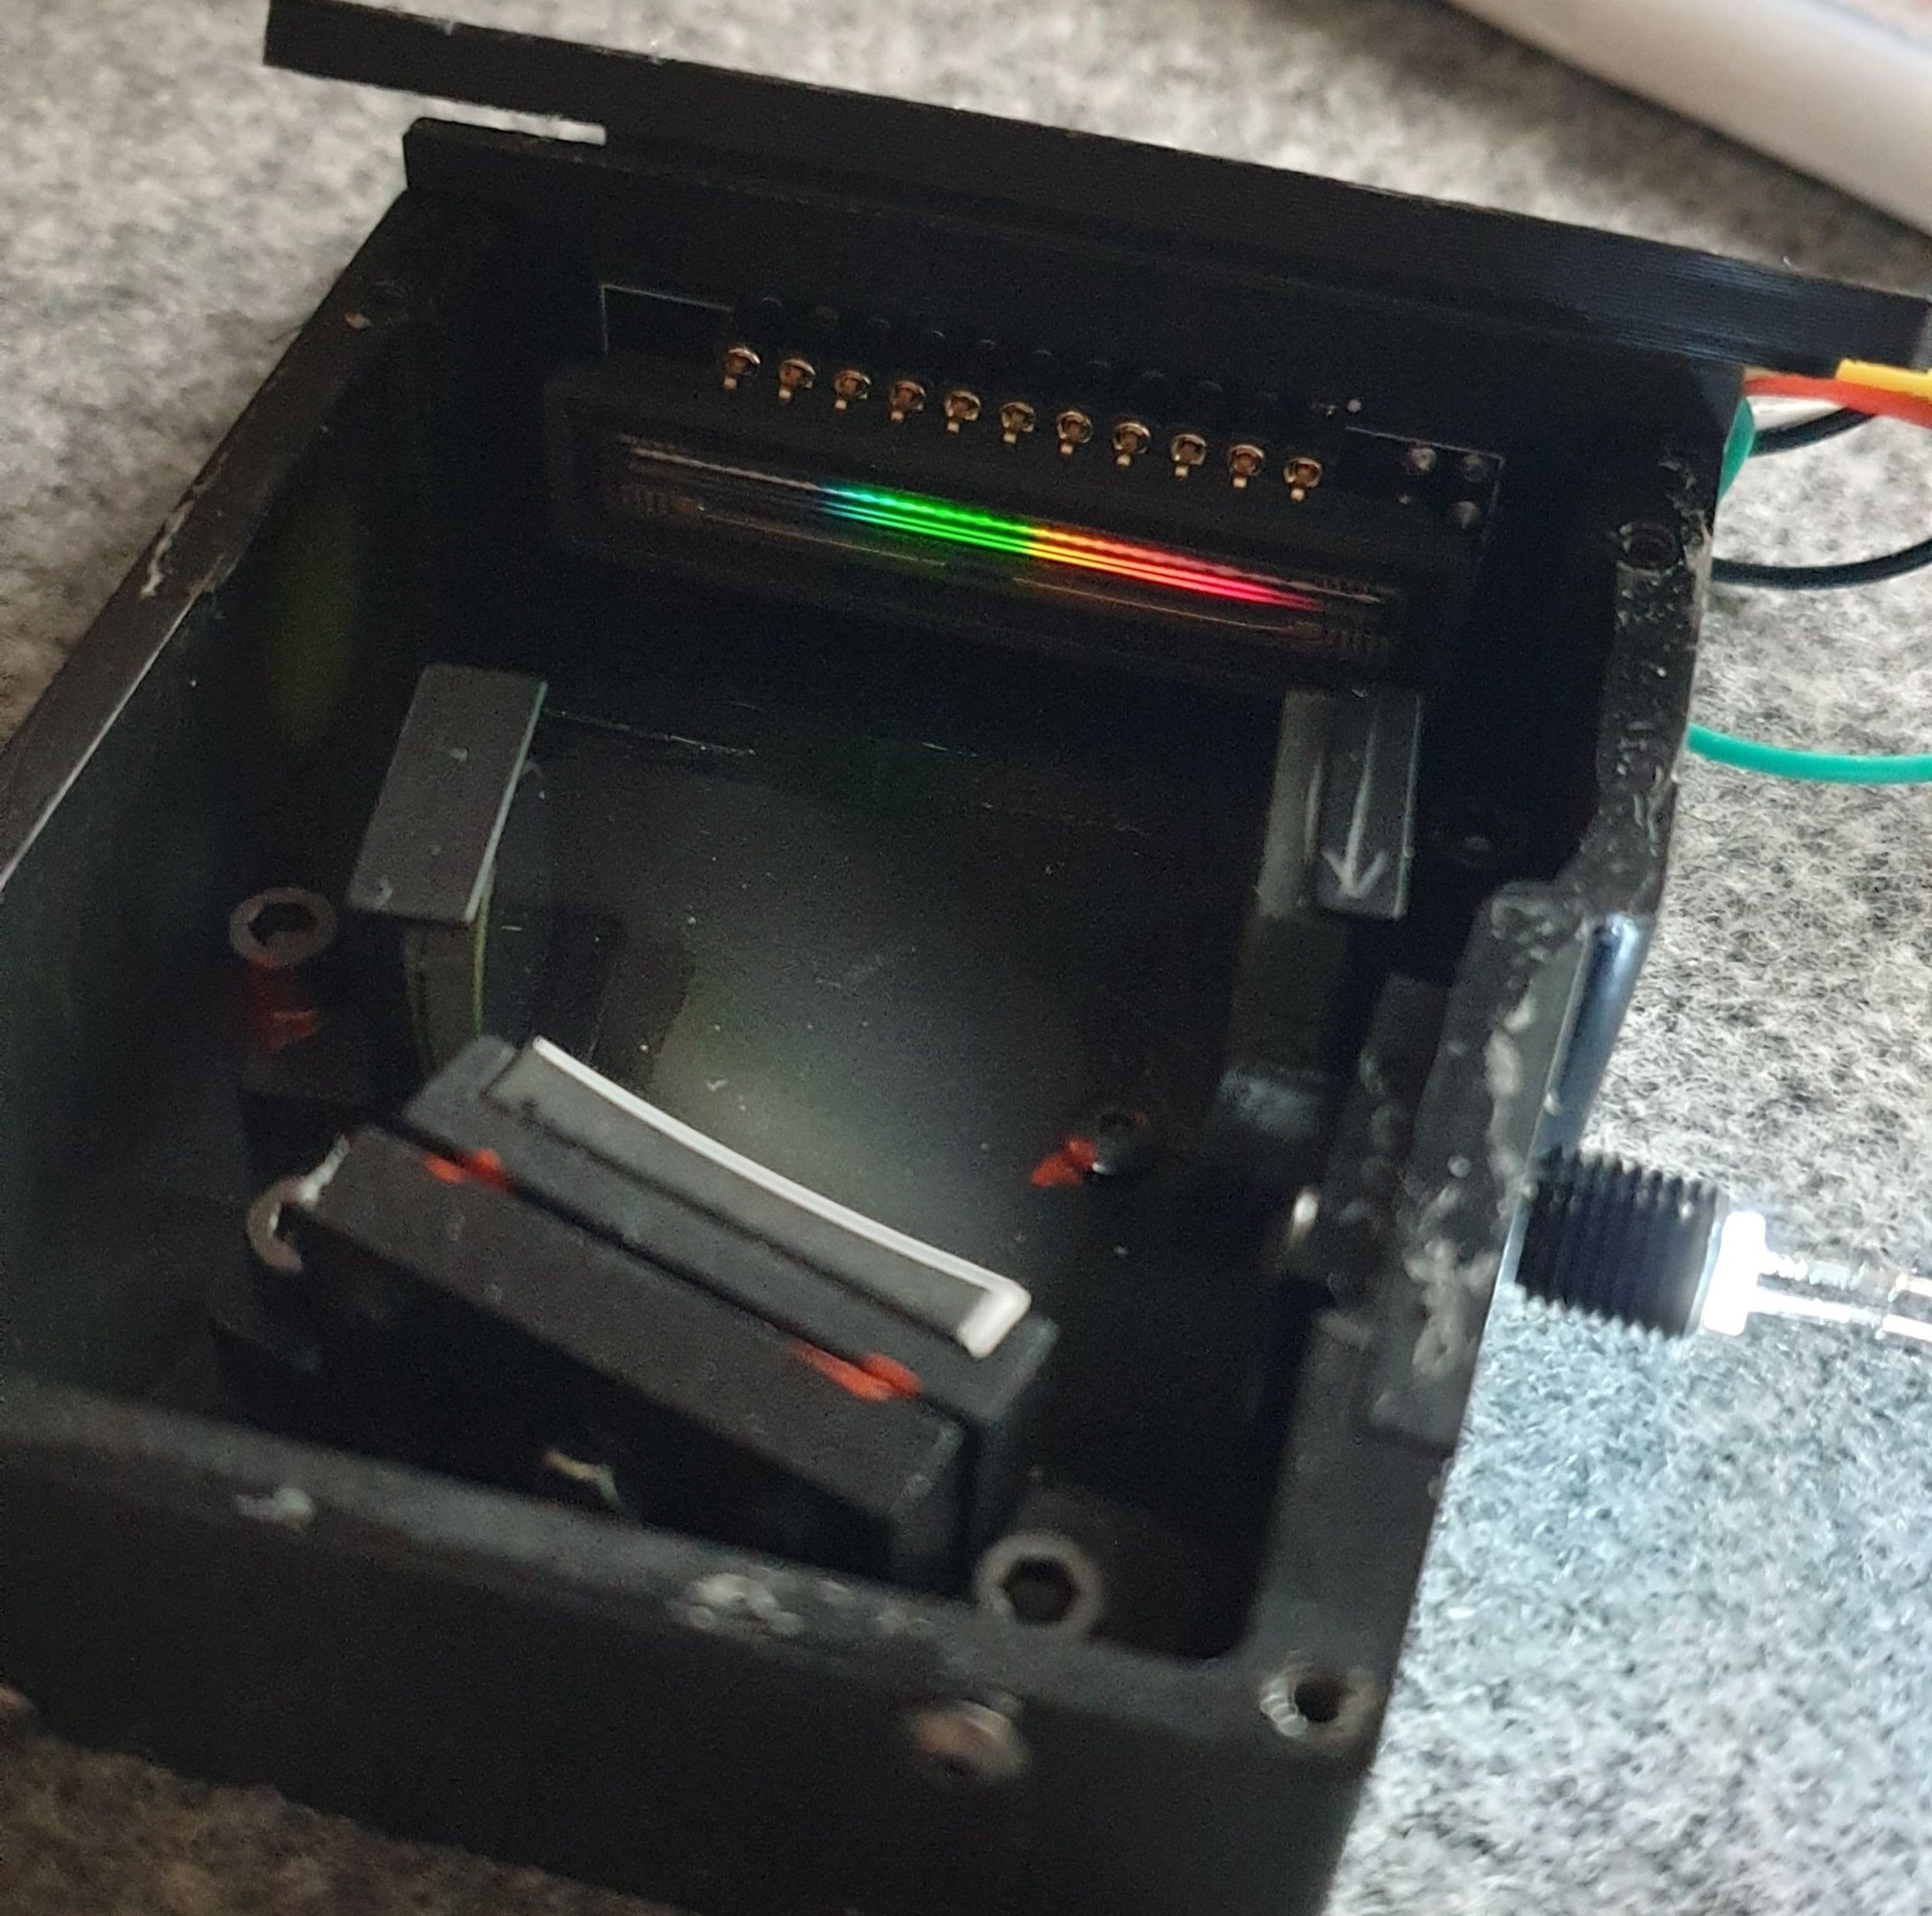
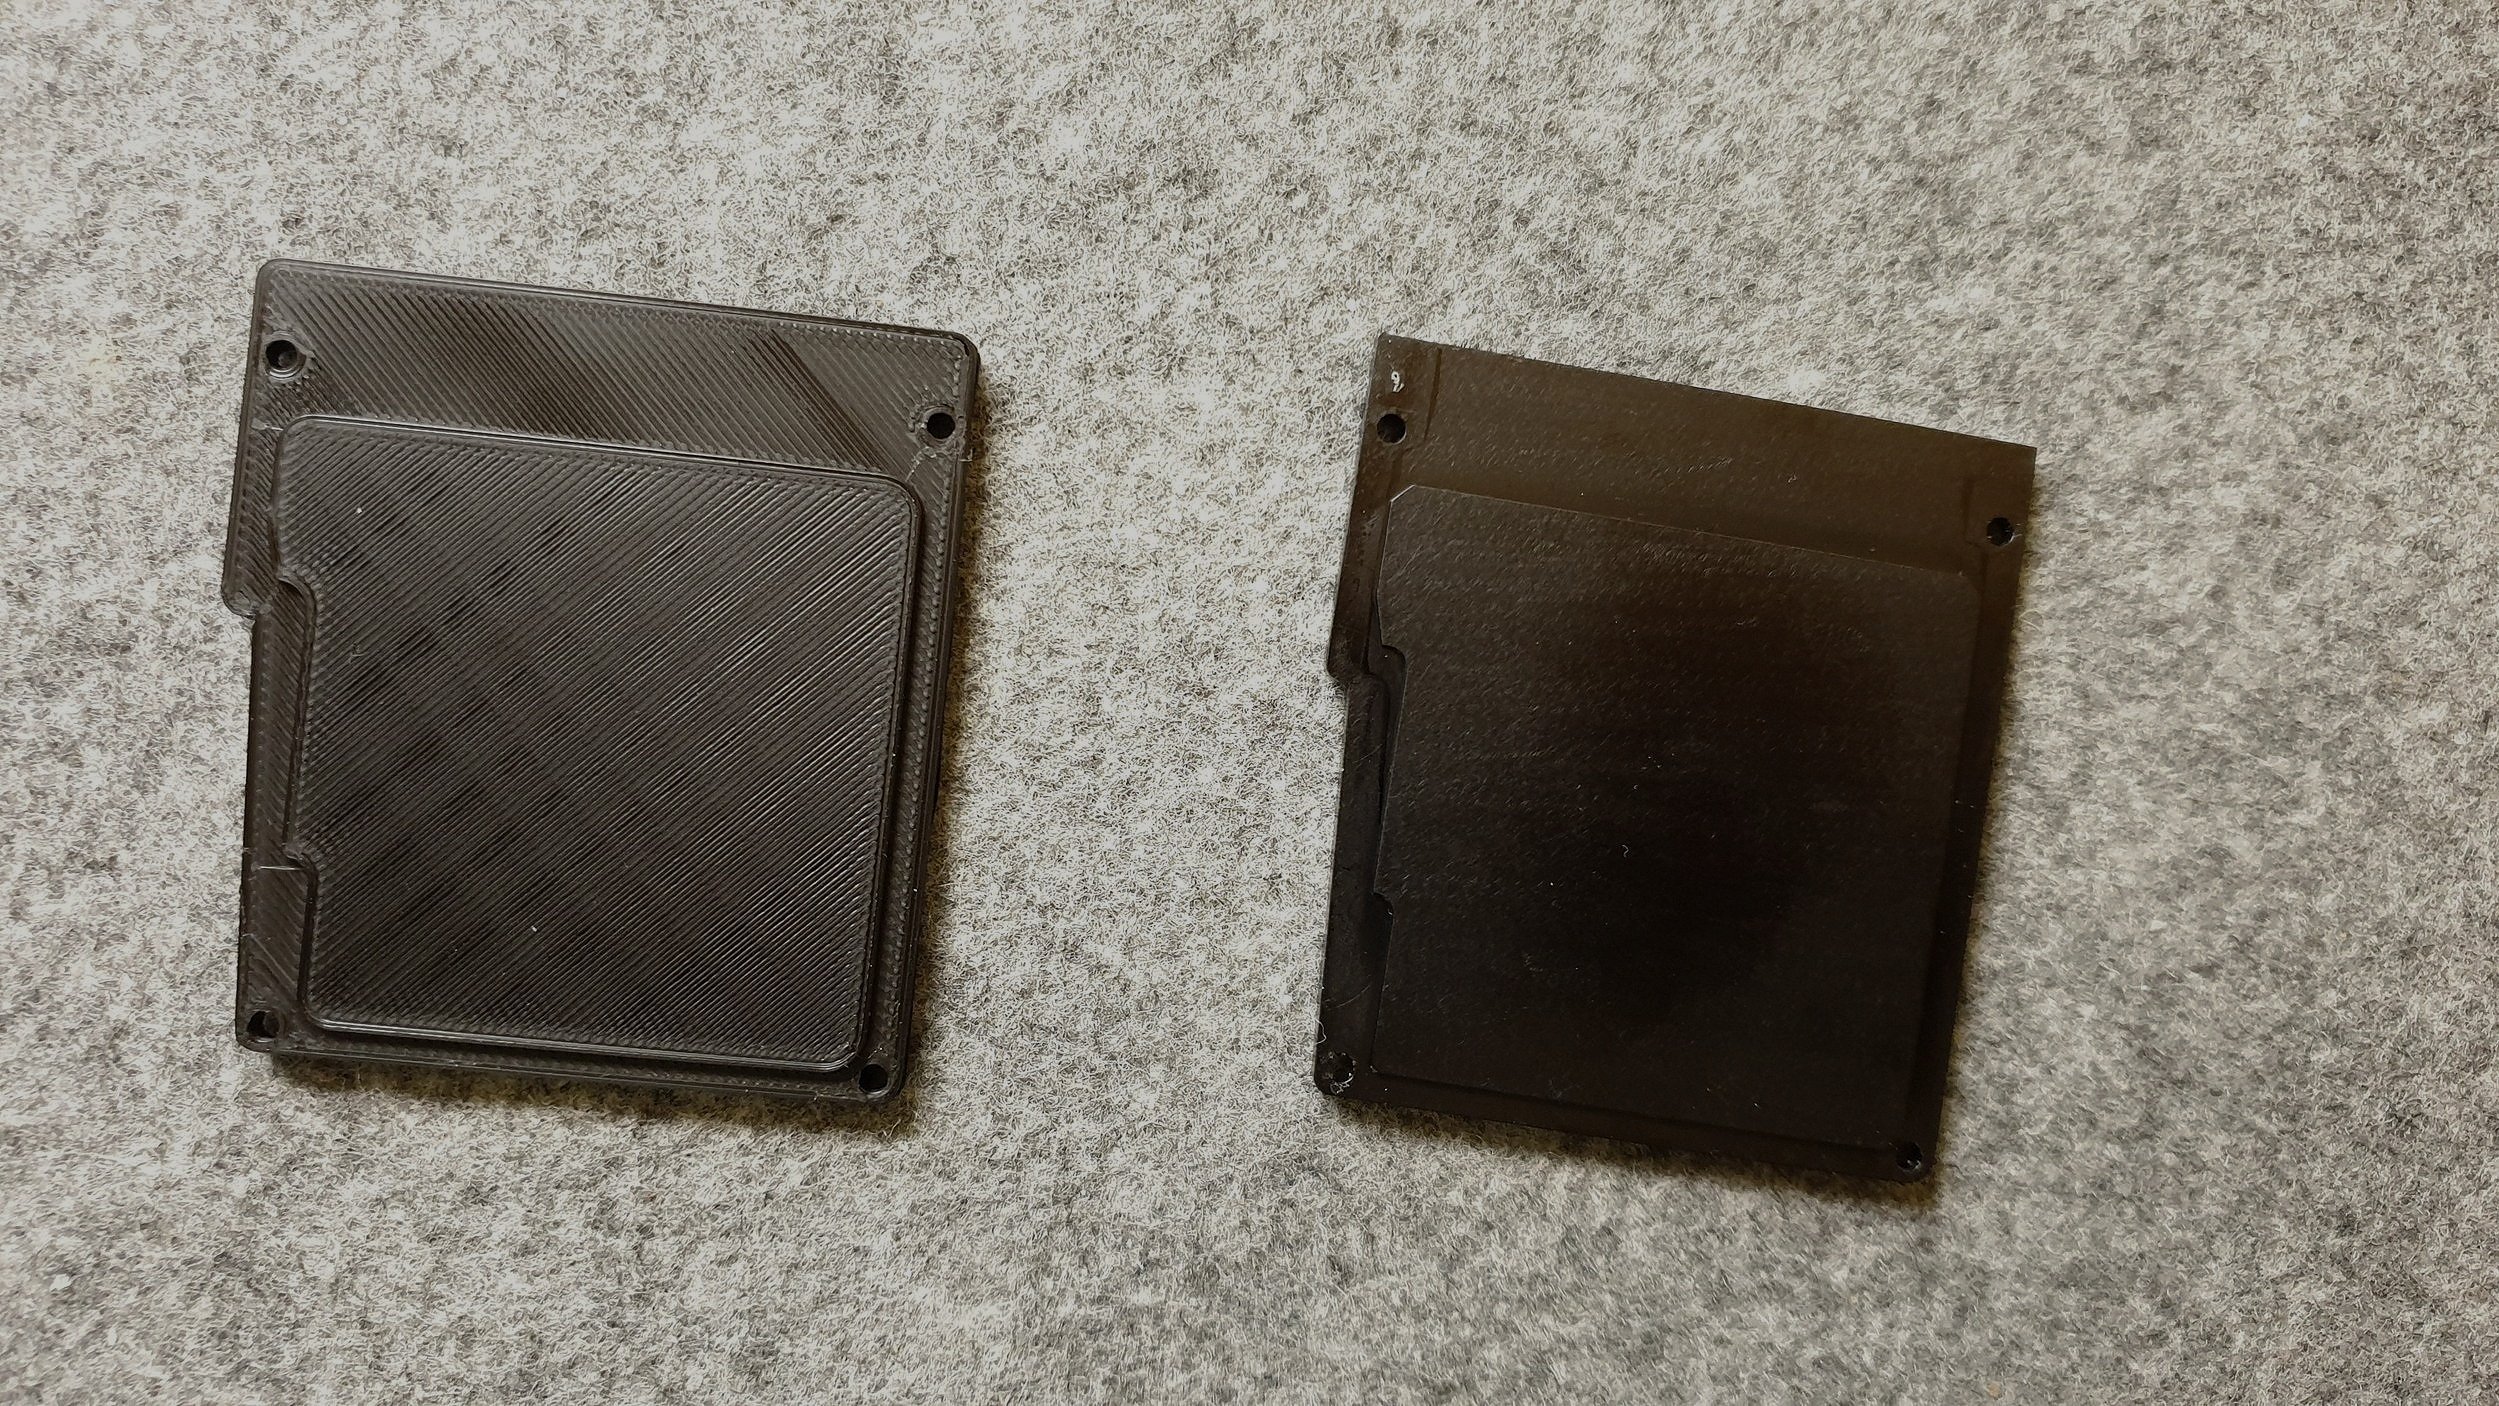
In this third part of the project I show you some new developments of the spectrometer and the capturing software. I rewrote the software for the microcontroller from scratch. I reconsidered the clock signals that drive the CCD as well as changed some parameters of the timers to get a more stable signal. I also figured out a smoother way to capture the data on the PC. The PC software got huge changes. I can assign both the pixel numbers and the wavelength values (after calibration) to the X-axis of the chart. The calibration can be done in the data acquisition software I wrote using a 2-point calibration. The calibration values are stored in a text file so the data is not lost when the software is closed. The wavelength-based chart has colours based on the wavelength. I converted the wavelength into RGB colors and assigned them to each points of the chart. So we do not only see the peak but we see the color of it too. Speaking of peaks, I also added a cursor that can read the wavelenght of the chart at any point, wherever we click on it. Finally, I drew and 3d printed a cover to my other spectrometer body. When I ordered these things, I ordered one "full spectrometer” without the CCD, and I also ordered a set of focusing mirror, grating and collimating mirror. This set was also similar to the full spectrometer, it was actually identical to it, but it came without the lid. So, I made a lid for myself and it turned out perfect.
Extra resources and information
Let me share a bit more details about the calibration, the resolution of the CCD and the range of wavelength that we can cover with the current setup.
Calibration
The calibration is actually very simple in this case. I used two different lasers with known wavelengths to calibrate the optical system. I used a green laser (532 nm) and a red laser (650 nm) for the calibration. I simply shined the laser through the slit of the spectrometer, and then noted down the position of the centre of the peak. This exercise gave me 2 pairs of numbers: 2 wavelength-pixel pairs.

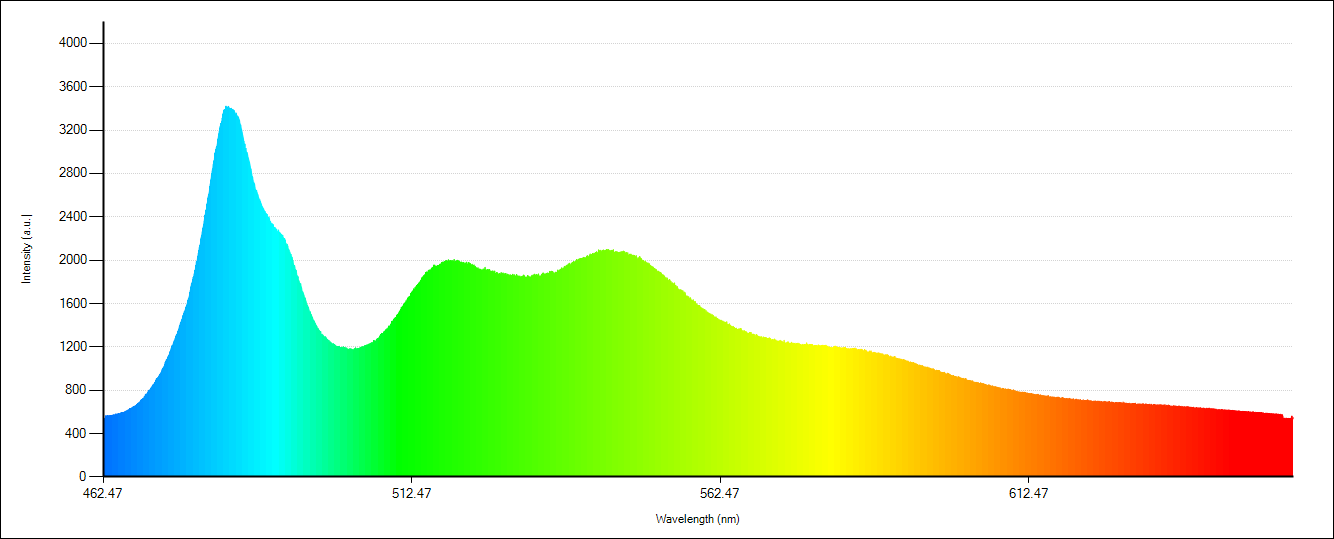
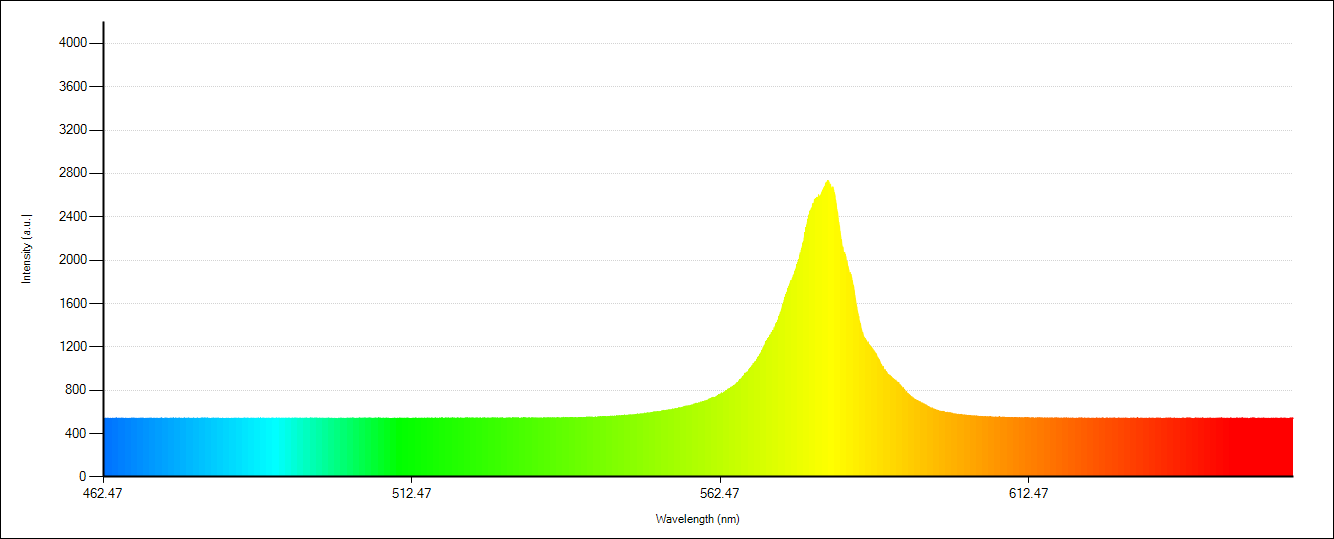
Green laser’s spectrum (532 nm). Nice and narrow peak.

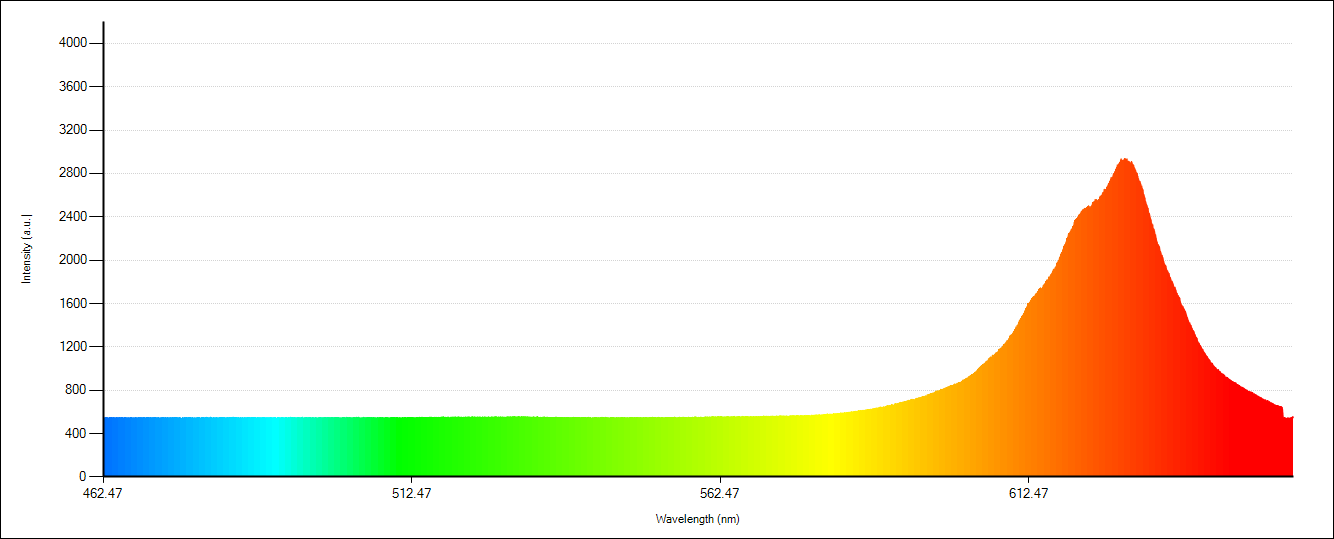
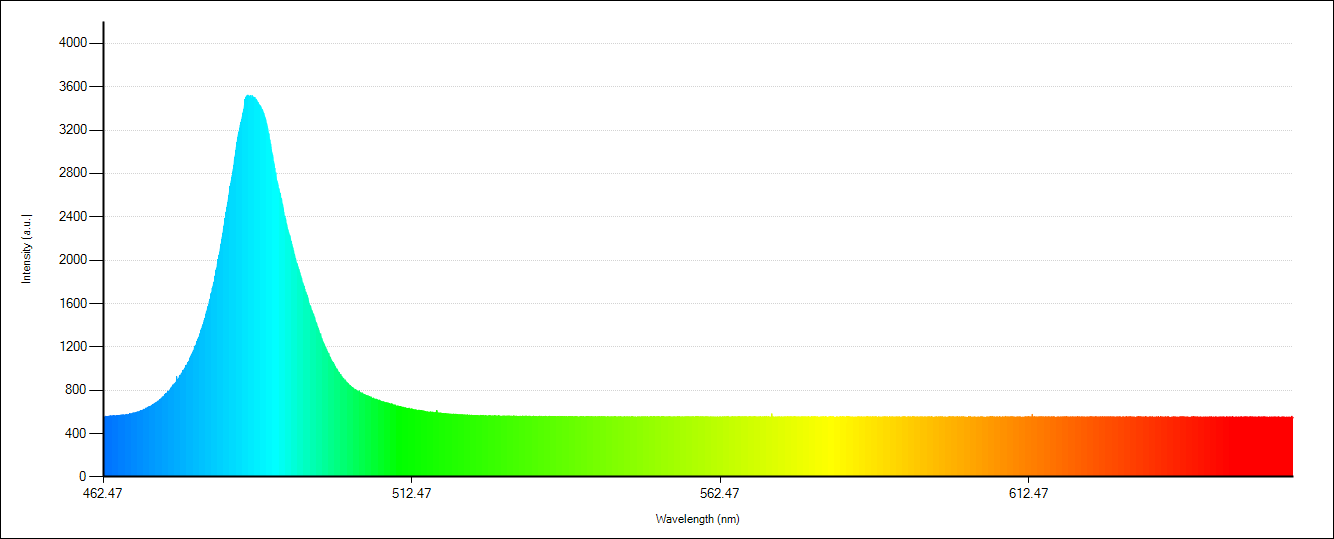
Red laser’s spectrum (650 nm). Still nice, but broader peak due to the fact that the laser shines close to the edge of the CCD.
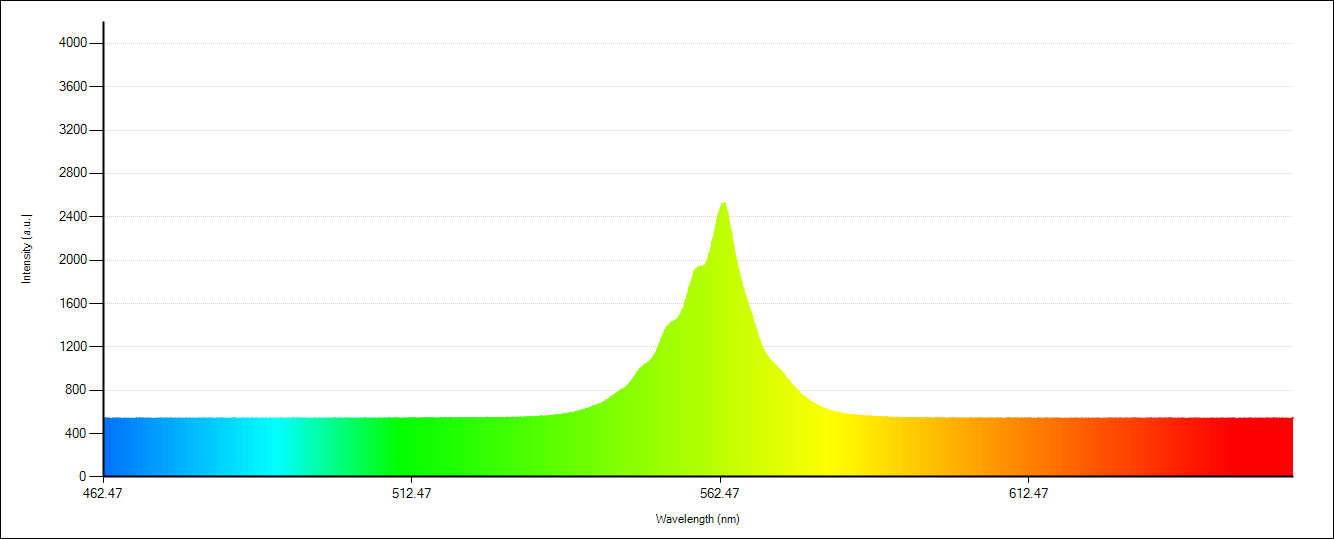
For the 532 nm green laser, the peak was at pixel number 2363, and for the 650 nm red laser, the peak was at pixel number 104. I rounded the numbers because while I can read fractions from the chart, the pixels are integers, there’s no such a thing as “0.41 pixel”. Fitting a line on these 2 points gives us -0.052 as the slope and 655.432 as the Y-intercept: Y = -0.0522 * X + 655.432. Since I chose the pixel number as the X variable and the wavelength as the Y variable, I just have to substitute X with the pixel number and I can get the corresponding wavelength. Using the formula I can calculate the highest and lowest possible wavelengths based on the number of pixels in the TCD1304 CCD. The pixel numbering starts at 0, so the highest wavelength is simply the intercept: 655 nm. The lowest is at 3693: 462 nm. Substituting the two numbers (655-462 = 193) we can get the resolution as well. The total range is 193 nm and the available number of pixels is 3694 → 193 nm / 3694 = 0.052 which is (not surprising, because the difference in wavelength divided by the difference in pixel numbers (basically, the distance between 0 and 3693 in pixel units) is) the slope of the calibration curve. So two adjacent pixels is basically 0.052 nm apart from each other in terms of wavelength.
However, I don’t think I have this resolution. The focusing mirror is not perfect and the focused image is not totally parallel with the surface of the CCD. I noticed that the peaks towards the edges of the CCD are wider, more smeared. This is probably because of the curved projection of the image of the slit. At the centre (green light), the peak is nice and narrow, but towards the edges (blue or red), the peaks are broader. Also, the lasers I used are just simple and cheap laser pointers. Even the sticker on the pointers states a 10 nm scatter around the nominal wavelength. So, yes, we need to keep these things in mind.
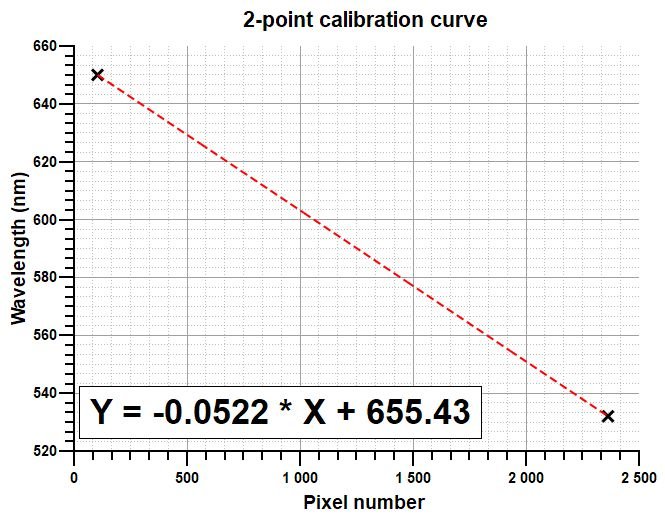
2-point calibration curve based on the laser wavelengths and pixel values.
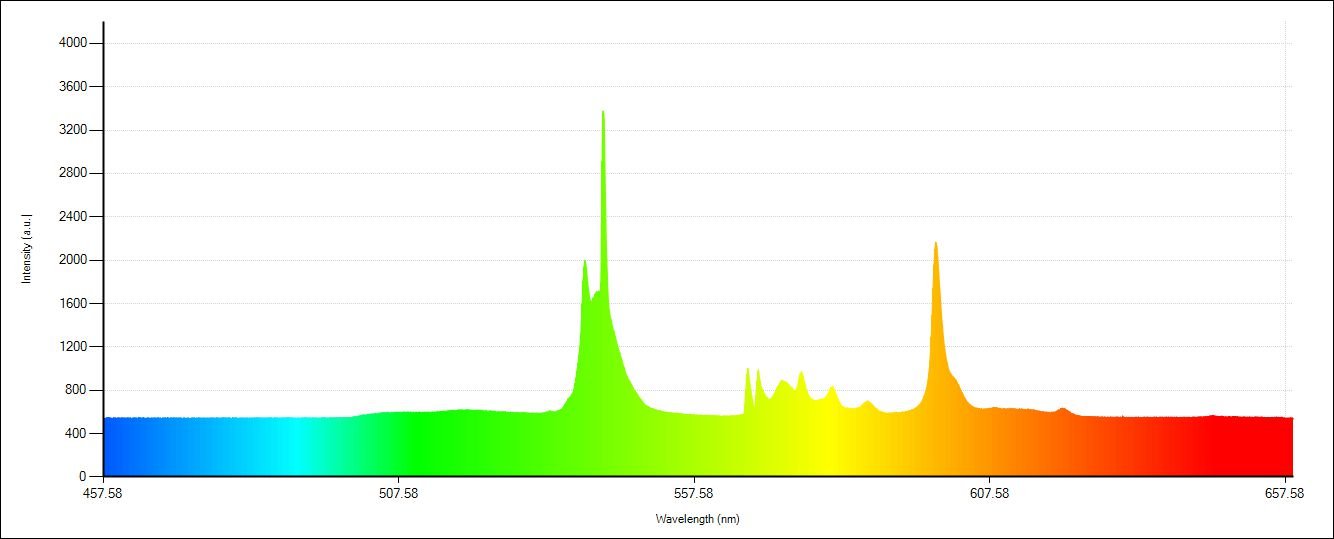
Since this is a spectrometer, it would be interesting to measure a few spectra. I did something similar in the previous work, but there I had to export the data, then process it in an external software to get the values in nanometers and I didn’t even had a nice rainbow background that helps to interpret the peaks, their wavelength and the corresponding visible light’s color.
A few spectra of different light sources
The next big task will be to adjust the mirrors in the spectrometer to flatten the focal plane and have a consistent performance across the whole length of the CCD. I will also try to test more light sources, but some of them require components like an ignitor or ballast and they are relatively expensive. It doesn’t worth the investment to produce a few colourful graphs.
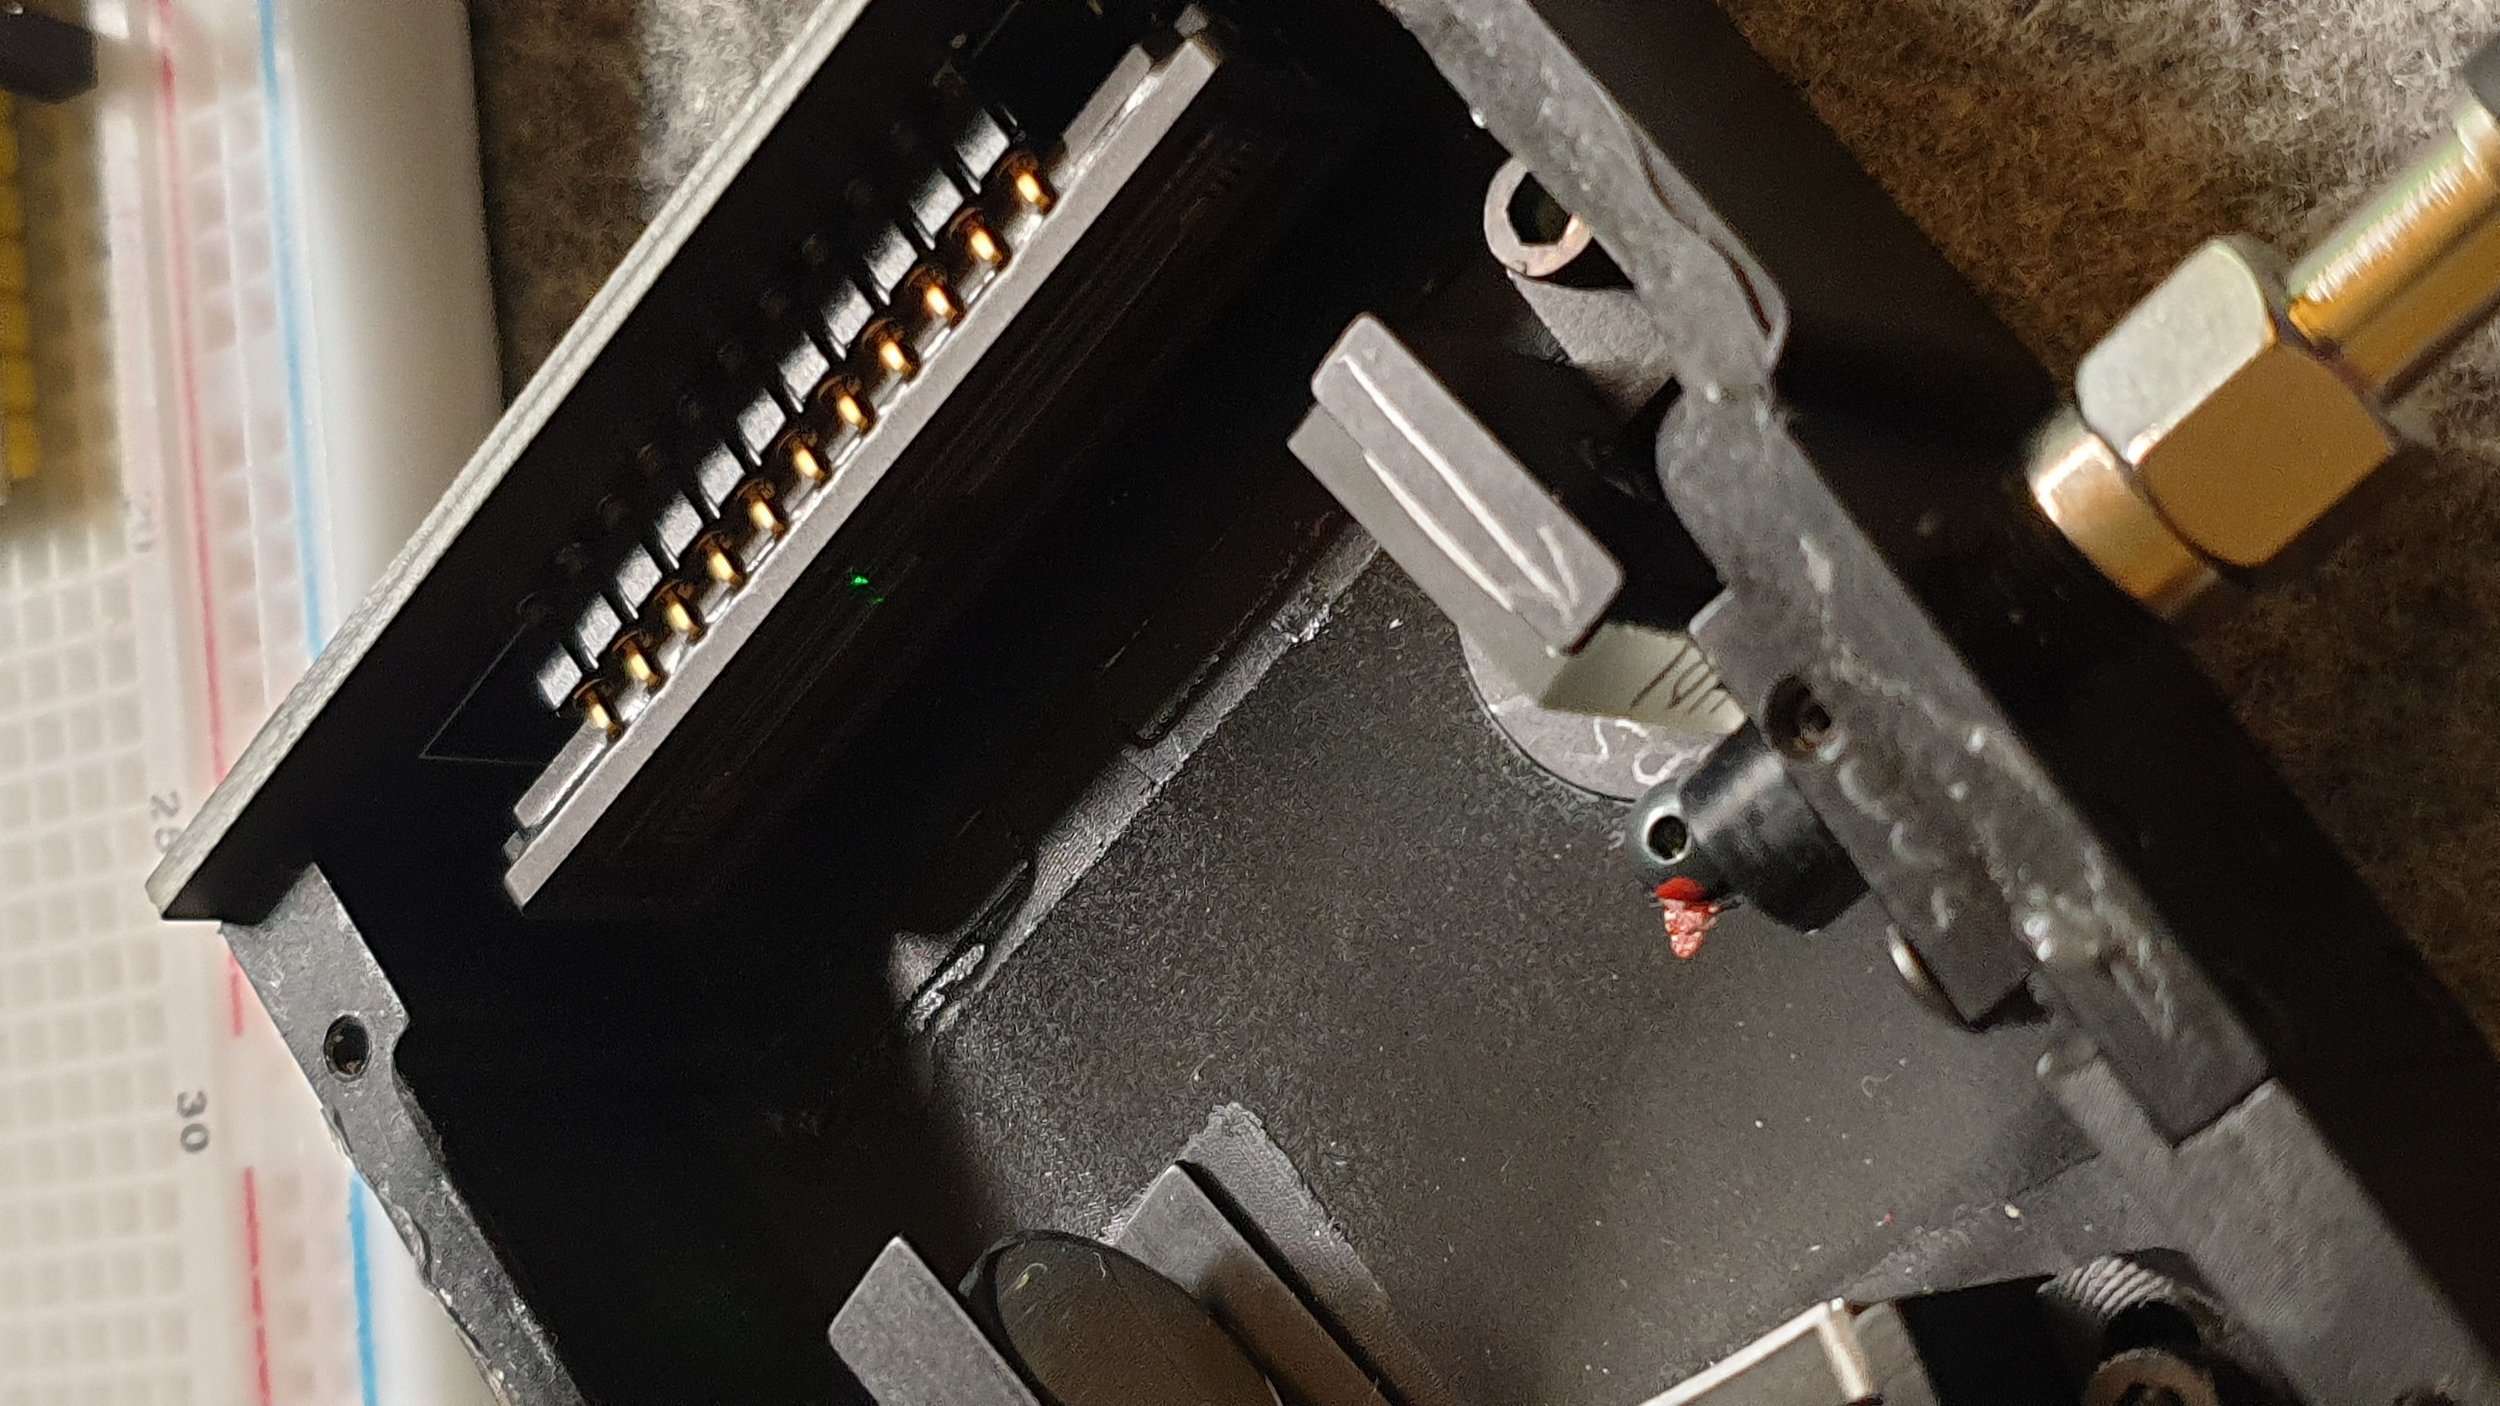
A few pictures of the spectrometer
Join my YouTube membership!
Buy my PCB using the link below: