100 W USB PD Programmable Power Supply with OLED display
In the previous article, I introduced my project, which is a 100 W USB PD programmable power supply I developed from scratch. I designed and then assembled the circuit, and I put together a firmware that does the USB PD communication, prints the relevant parameters on a display, and controls the relevant hardware on the PCB. In this article, I continue the development of the project. Previously, I hinted that I might add an OLED display to the project, and I also hinted that if someone is kind enough to support me with a donation, I would buy a proper 100 W USB adapter and test the circuit and demonstrate the power supply’s full capabilities. So, I got not one, but two kind people to help me, so now I have the proper power supply, and I also worked on a firmware that displays the data on a 2.42” OLED display.
Refresher
For those who encountered this article before seeing the original device, here’s a brief refresher. The main difference between this and the previous device -hardware-wise- is the display; otherwise, the PCBs and everything else are identical. Obviously, I had to slightly redesign the enclosure’s front panel to accommodate the OLED display, too, but that was very easy.
So, the device is a 100 W USB PD programmable power supply. With the appropriate power adapter, it is able to provide up to 20 V and 5 A. The device has two modes:
PDO, where the device can source pre-programmed voltages (5 V, 9 V, 12 V, 15 V and 20 V) and currents based on the power adapter’s capabilities.
PPS, where the device can act as an adjustable power supply between certain voltage levels (5 V - 16.0 V) with a minimum voltage step size of 20 mV. The voltage range and the supplied current depend on the power adapter’s capabilities.
To be able to communicate with the power adapter, the device has a CH32X035G8U6 microcontroller. This MCU not only does the power negotiation, but it also manages the display, the rotary encoder, the INA226 power monitor chip and the LM73100 ideal diode. All these components are put together on a PCB that I designed.
Due to the nature of the circuit’s operation, it had to be prepared for a wide input voltage range. Since it is a programmable power supply, the input voltage (which is also the output voltage on the banana terminals) can be anything between 3.3 V and 20 V. The device must stay operational between these voltages and should provide a stable voltage for all the circuit components. Therefore, I implemented a buck-boost converter based on the MP28167 chip that ensures that the circuit is fed with a stable 5 V no matter what the input voltage is. This 5 V then later dropped down to 3.3 V and is fed to the microcontroller, the display, the power meter chip and so on.
The output power is monitored by an INA226 power meter chip that measures a 5 milliOhm shunt resistor that is placed just before the positive output terminal.
I also made it possible to enable or disable the output power. This was made possible by using the LM73100 ideal diode. It is not only a power switch, but it also provides a certain level of circuit protection. It serves as both physical circuit protection and a software-controlled power switch for overvoltage and overcurrent protection.
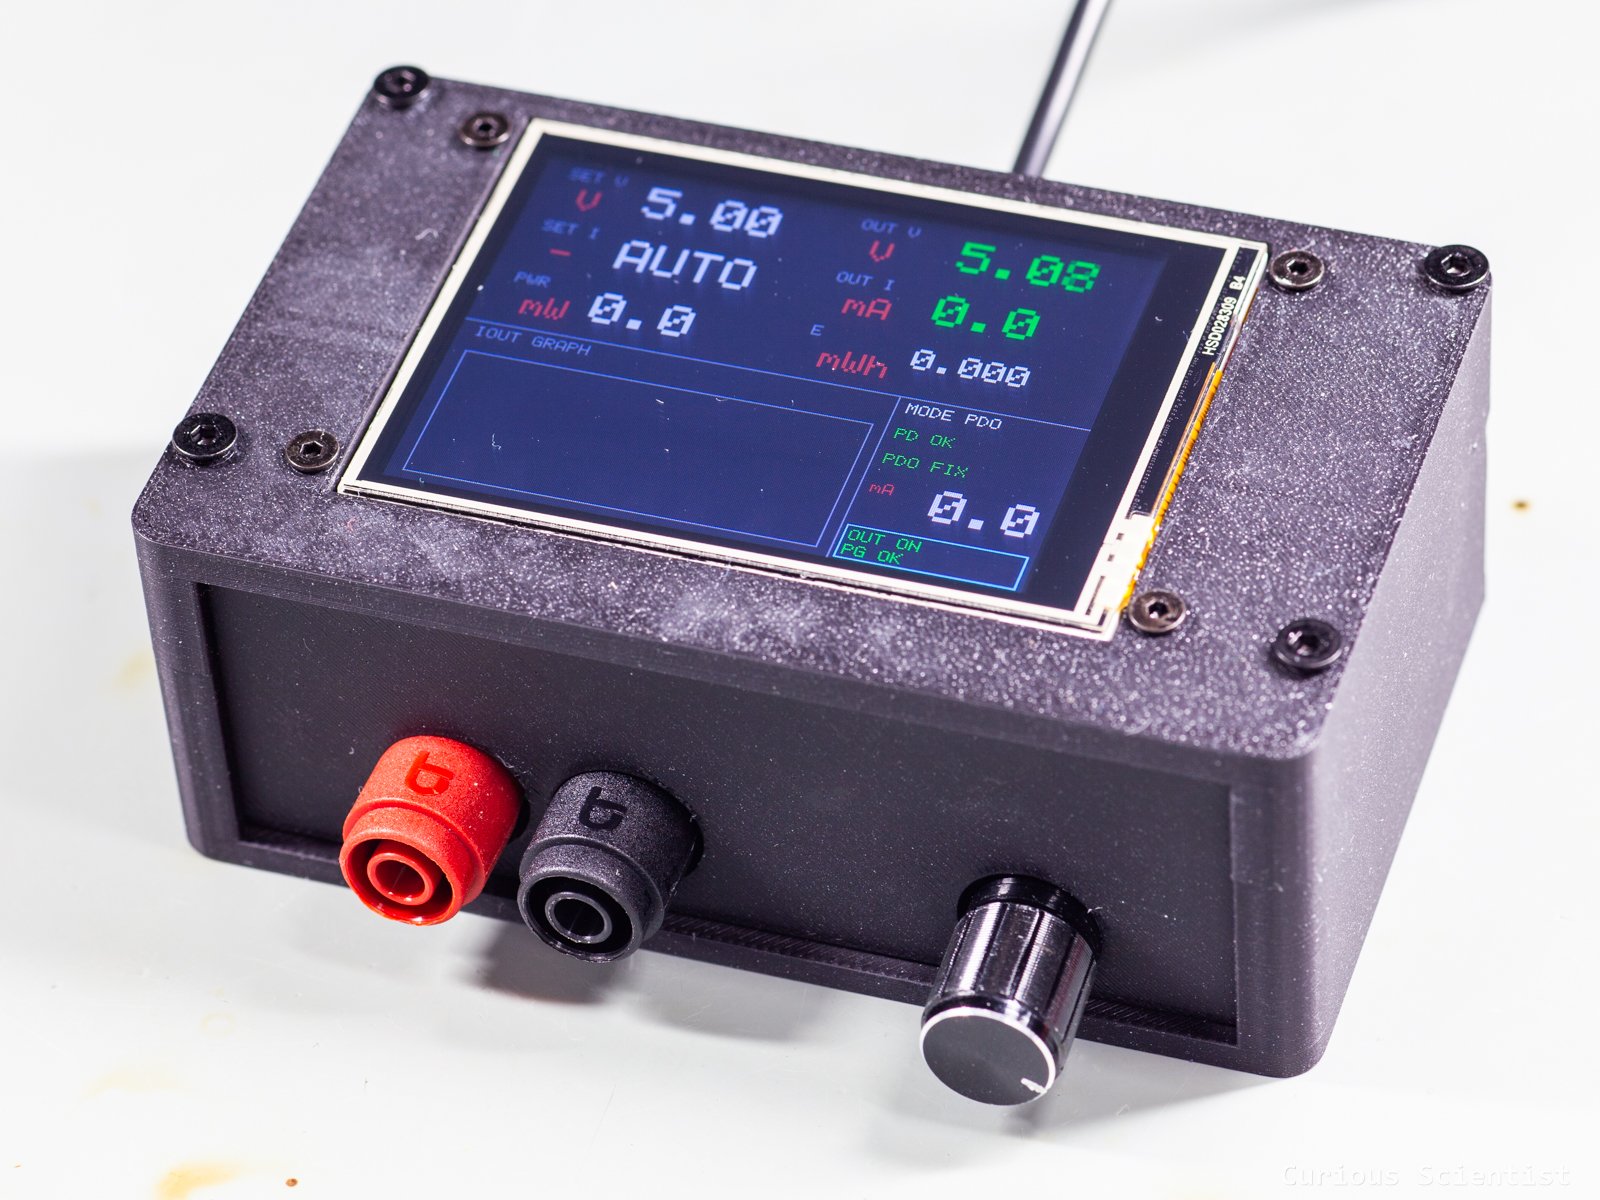
Complete product with the 2.8” TFT LCD.
What’s new
So, let’s talk about what’s new. The first and most obvious change is the OLED display. I had these displays for years and never really used them, so this project was an excellent excuse to finally incorporate them into a device. What I like about these displays is that they have relatively large pixels due to a combination of large display area (2.42” diagonal) and low resolution (128×64). This, and the fact that it is an OLED display, result in a very readable display. The outline of the characters is extremely clear, and thanks to the fact that there is no backlight, the contrast is also strong. It is much more readable than the TFT LCD, in my opinion.
Sure, the smaller display area (2.42” vs 2.8”) and the lower resolution (128×64 vs 320×240) set some limitations, but I could work around those. In the previous build, I could cram everything- controls and telemetry- on a single page. This was possible due to the larger number of pixels and the colours. Highlighting and distinguishing information is much easier on a colour panel. On this smaller OLED display, I had to do it differently.
I broke the information down into smaller pieces and distributed them to pages. Now, there are 7 pages where different information is shown. This needs a bit more work from the user, but I promise it is worth the effort because everything is clearer and more organised.
The other new thing is that I bought a 100 W USB adapter thanks to the generous supporters. I bought an Anker 317 charger. It seems to be a reputable brand, and the adapter supports USB PD and PPS. So, I gave it a shot. It should be able to source 3 A on all the PDO voltage levels, except at 20 V, where it can go up to 5 A. And its PPS supplies 3.3 - 11 V at a maximum of 5 A.
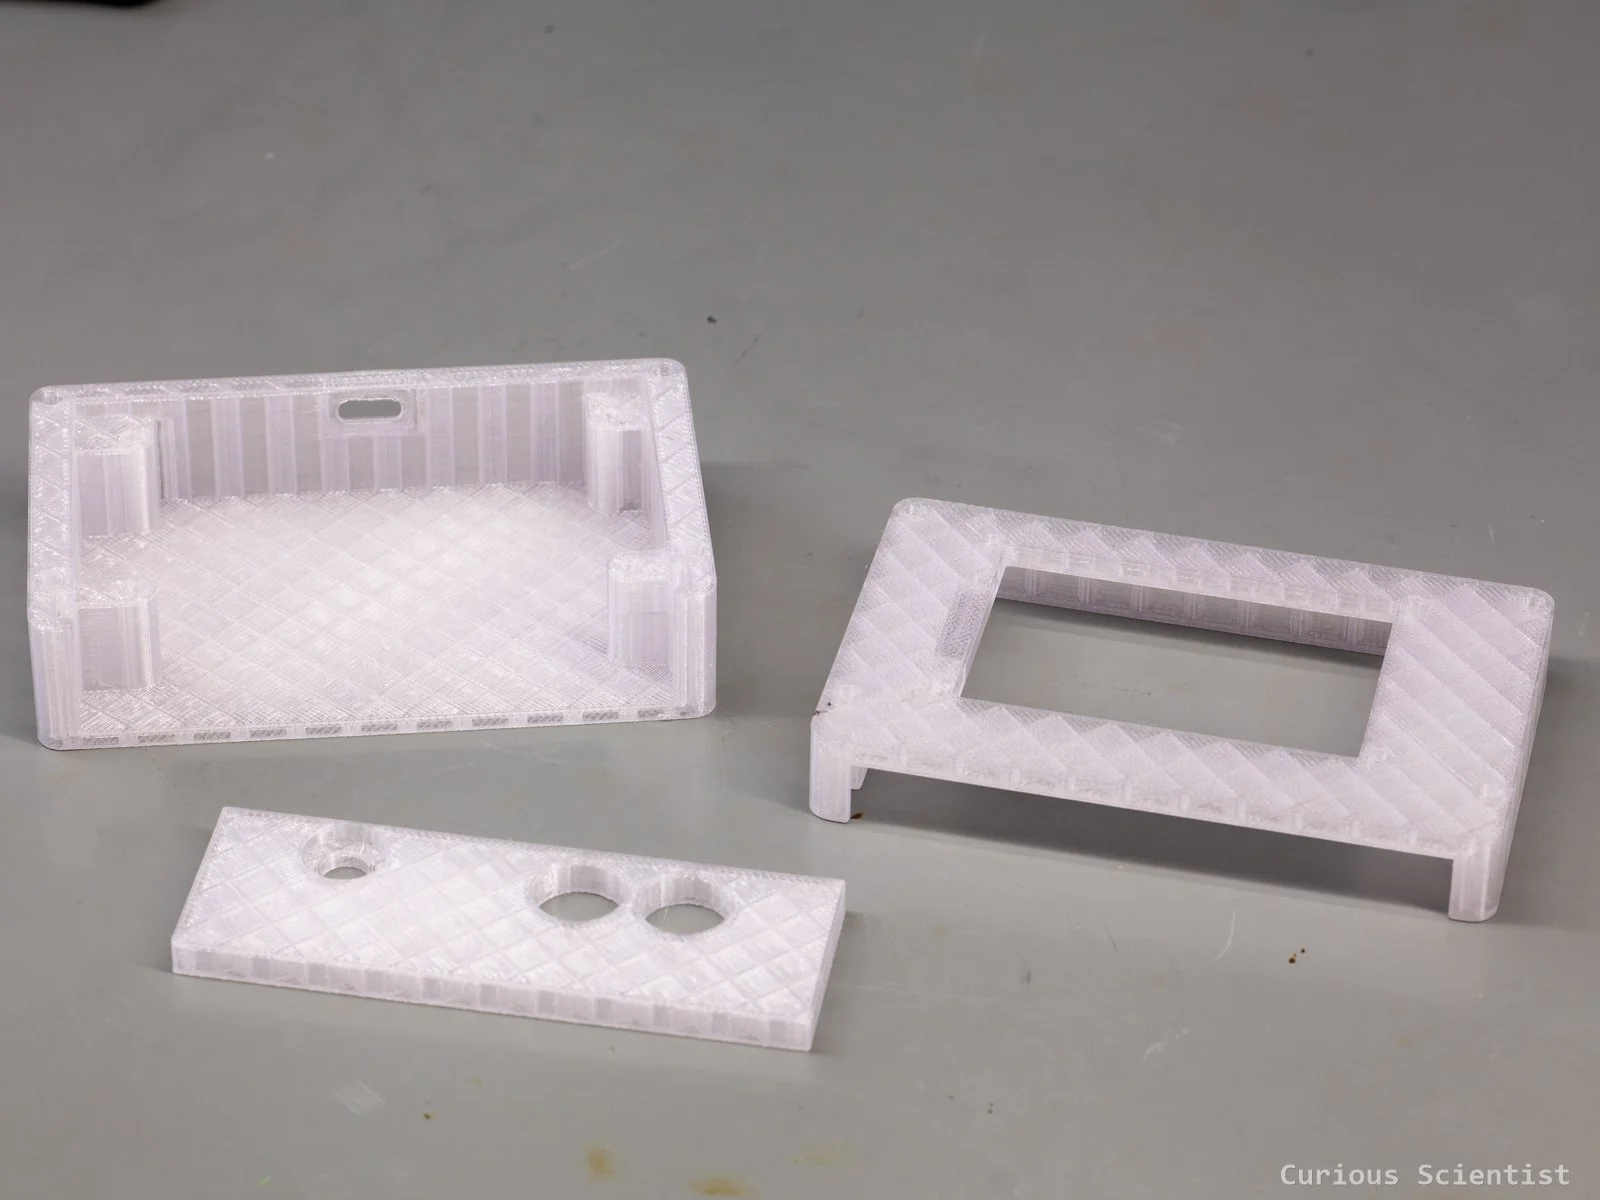
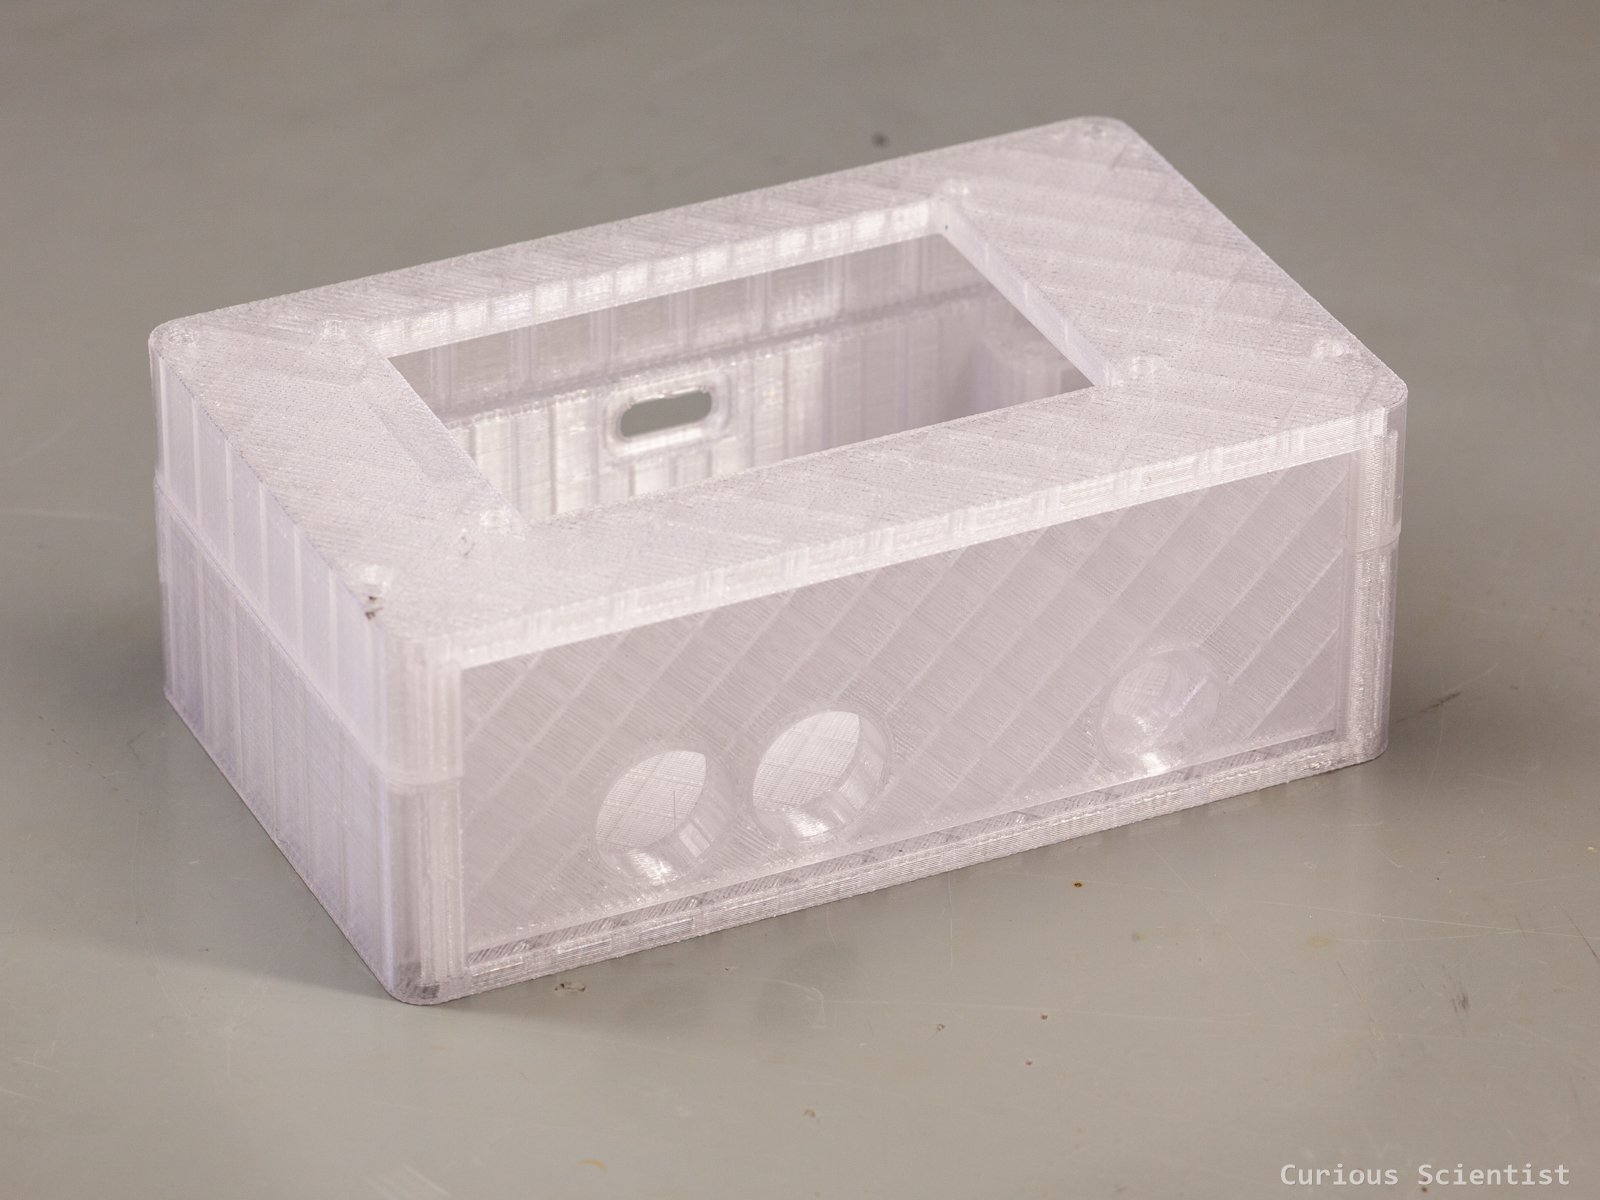
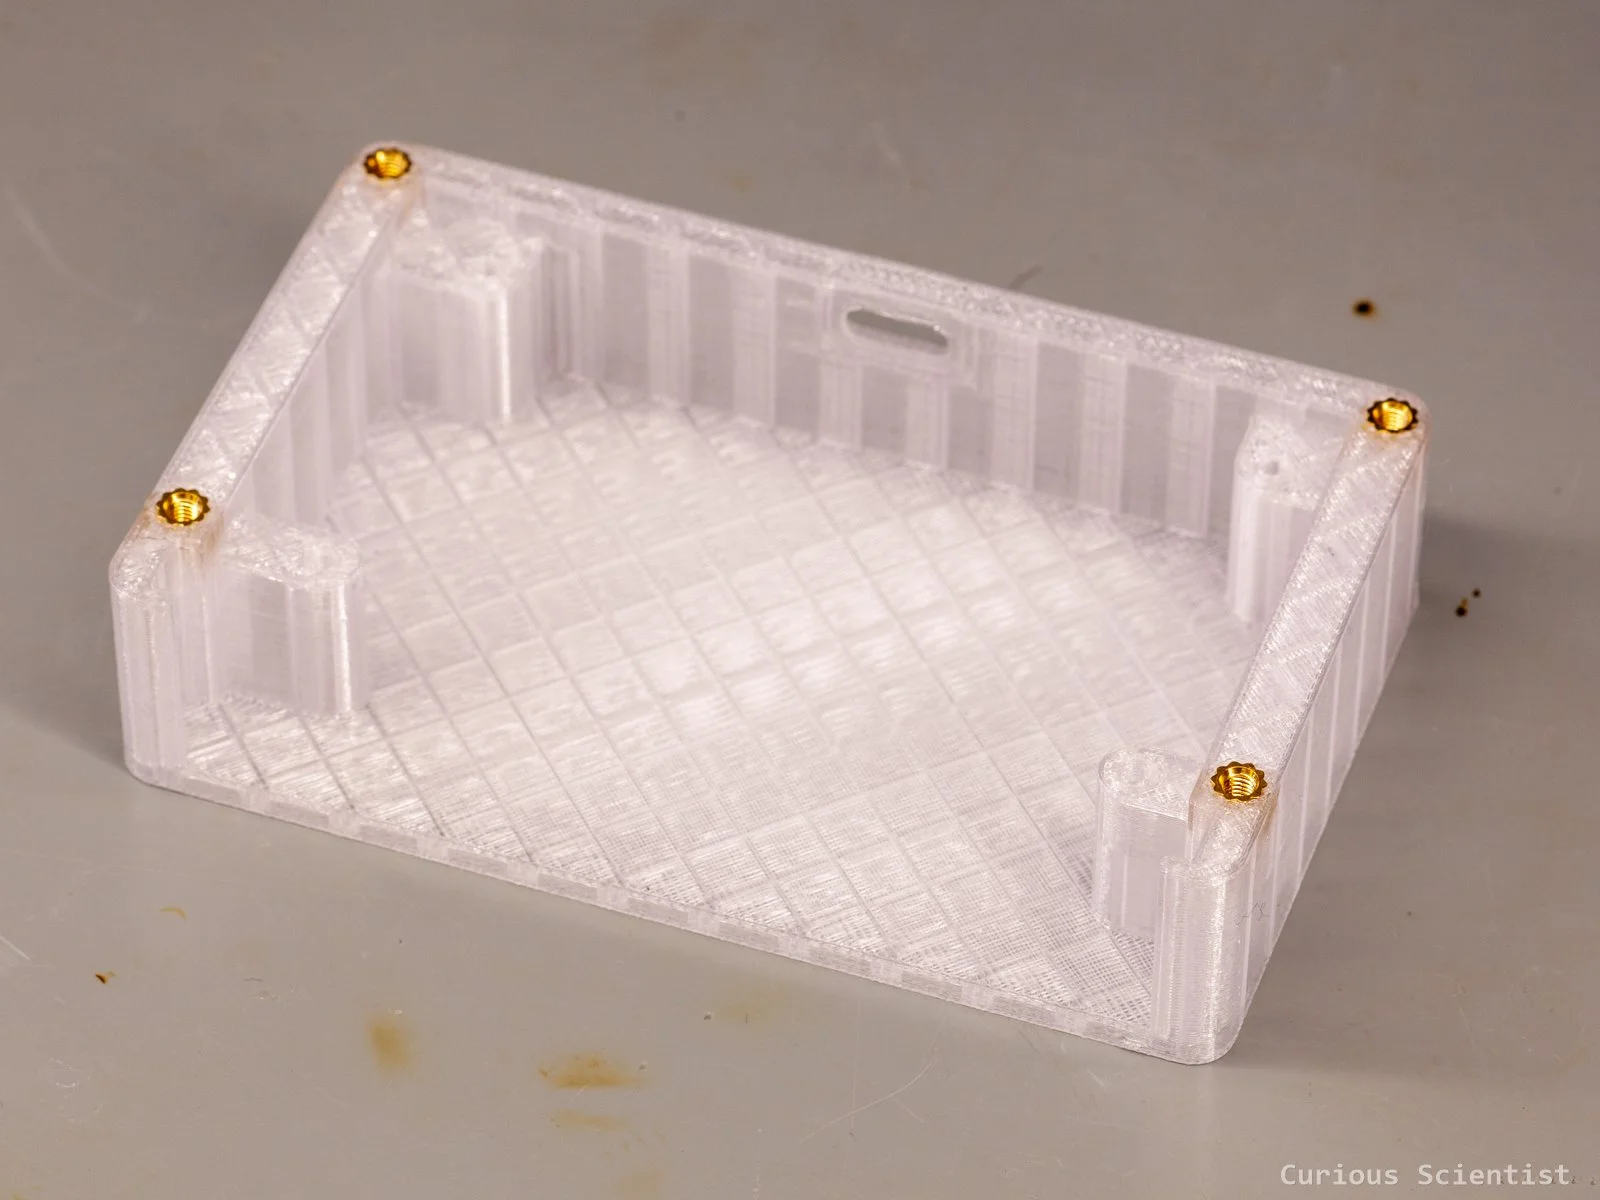
To accommodate the display, I also reworked the top panel of the 3D-printable enclosure, but this is not a big deal. For fun, I printed the enclosure with transparent PETG filament. Of course, the enclosure hasn’t become transparent, but somewhat translucent. This made it possible to see the buck-boost converter’s green status LED. It looks quite cool. If I turned off the overhead lights and covered the enclosure with my hands, I could even see the 3.3 V rail’s amber status LED.
In the chapters below, I will share all the details about the news and upgrades.
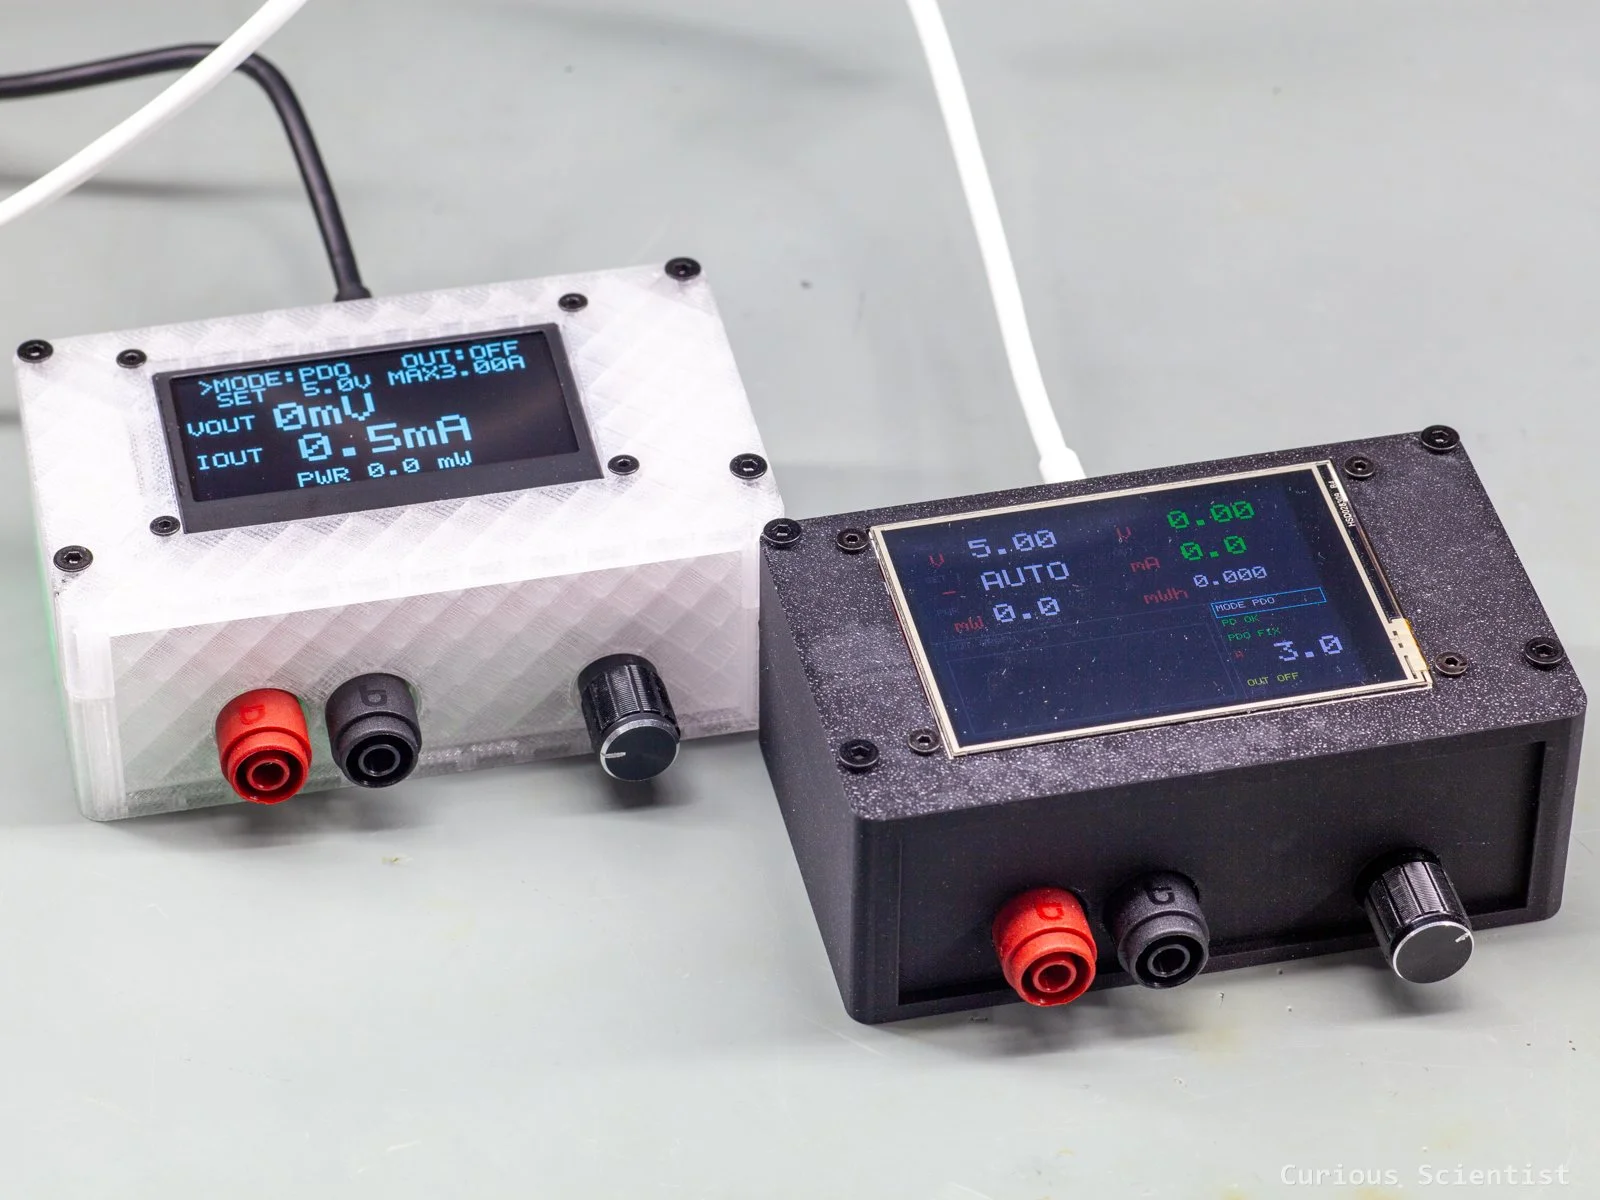
The device with the LCD was placed in a better position in terms of lighting and the camera was focused on the LCD. The OLED’s brightess was set to 60%!
New display and menu structure
As I mentioned, the new display required me to rethink the display layout and restructure the menu items. I split the parameters and controls into 7 pages. I changed the way the data is printed, added more graphs, and even more features.
Navigation
The hardware is unchanged, so the navigation is still done by using a rotary encoder with a switch. But since the program now has several pages and even more editable fields, the navigation had to be adjusted. It is fairly intuitive. Rotating the encoder clockwise navigates forward, and rotating it counter-clockwise navigates backwards. I had to come up with a mode to indicate the highlighted field, so I did what I already did in some earlier projects. A “>” symbol indicates the highlighted field. Think about it as a cursor or little arrow. When the encoder’s switch is pressed, the symbol changes into the “#” symbol, which means that we are in edit mode and we can modify the selected value. Pressing the switch again saves the actual values if there are no illegal values selected (more on this later!) and returns to navigation mode. We can navigate in both directions. If we navigate backwards on the first page, we’ll end up on the last page and so on. I also added a quick forward jumping mode: Double-clicking the encoder switch jumps to the next page.
Main display
The main display contains the most important information, and it is used to control the power supply. The first two lines represent the operating state: mode, output status, requested voltage and corresponding current. Then, there are two lines, VOUT and IOUT, which are the actual, measured values by the shunt resistor and the INA226 chip. Under load, the voltage can sag, so the actual output voltage can differ from the requested voltage. Finally, on the bottom line, the product of the actual current and the voltage, power, is shown.
The MODE can be PDO or PPS, and the user can switch between them by clicking the encoder when the field is highlighted. The PDO mode, as I mentioned, consists of several fixed voltages and corresponding currents based on the power adapter’s capabilities, and the PPS mode is the adjustable power supply mode.
The next item, OUT, is the power enable/disable button. Similarly to the MODE field, this field is also a 2-state toggleable field: it can be ON or OFF. This button turns the ideal diode on or off. We can negotiate any voltage and set any current on the device, but as long as the diode is off, the negotiated voltage won’t appear on the output.
The negotiated voltage is set in the next field called SET. In PDO mode, we can scroll through the available voltage levels, and in PPS mode we can set the required voltage value within the power adapter’s capabilities. In PPS mode, we can also adjust the current limit, but this has some limitations. In PDO mode, the current follows the maximum advertised current.
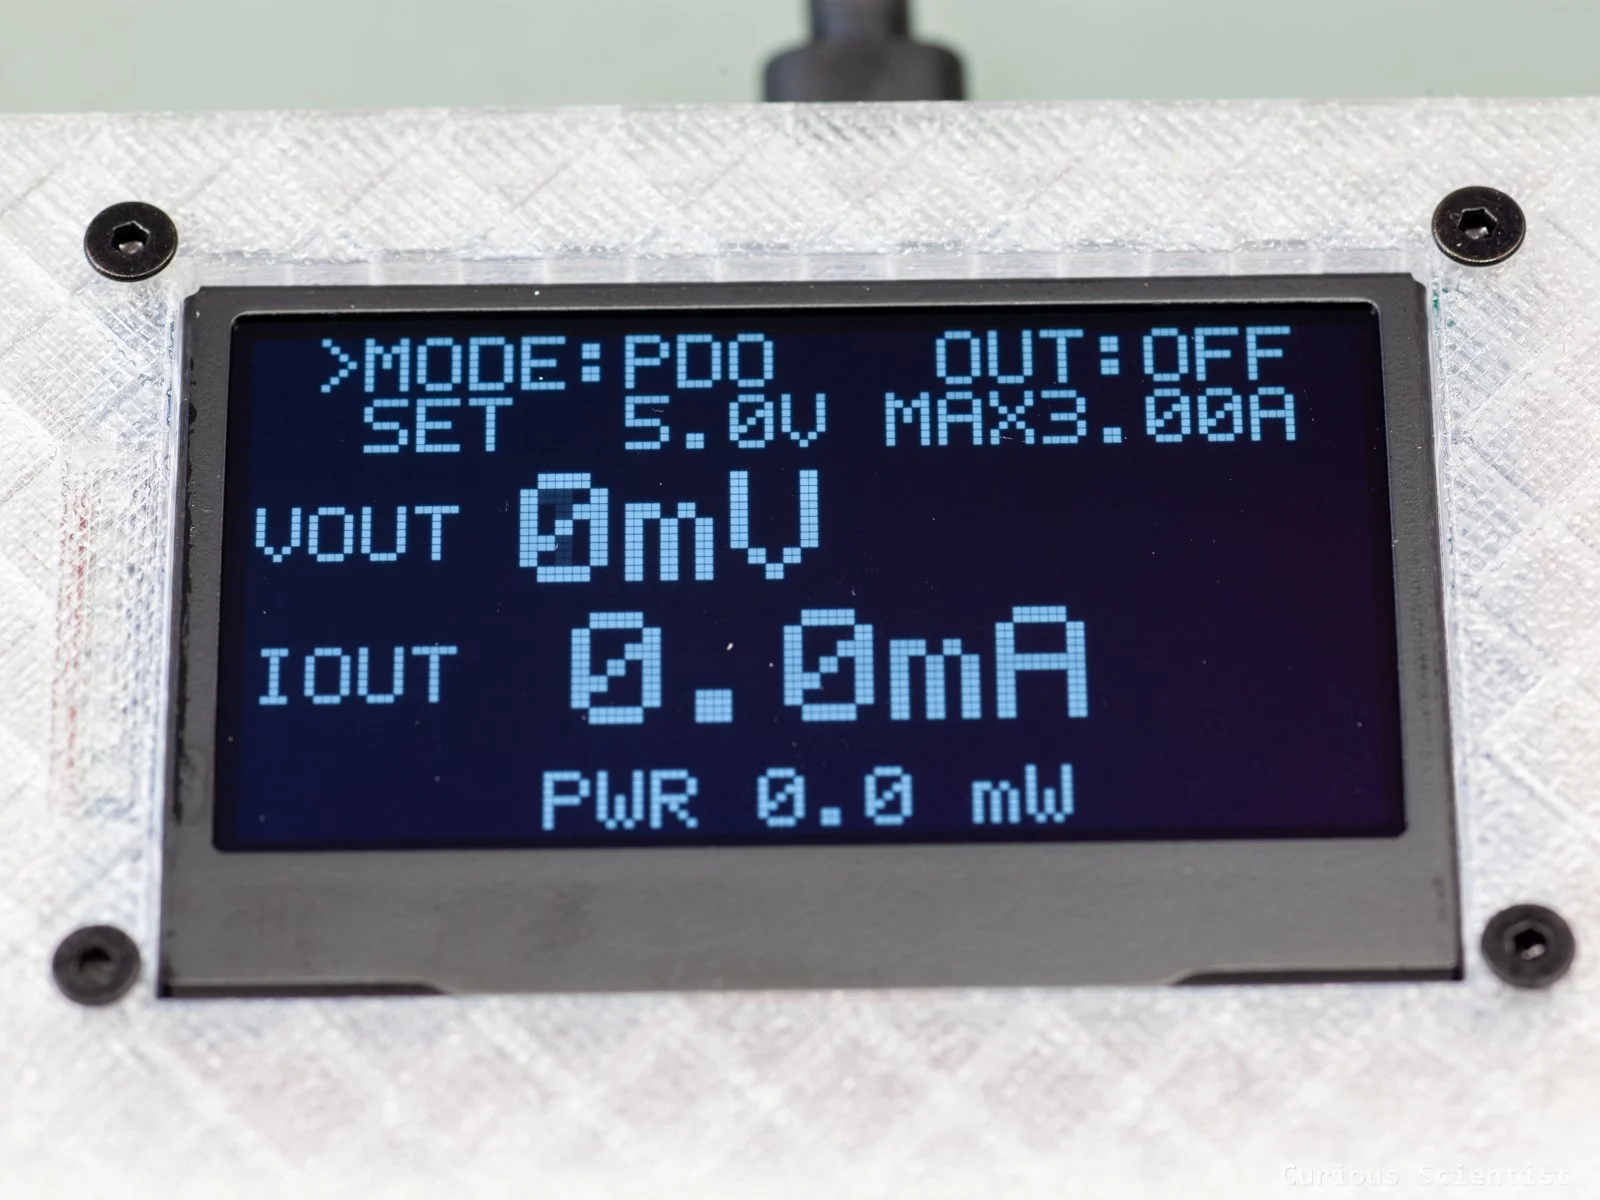
Main display with the output parameters
Protection page
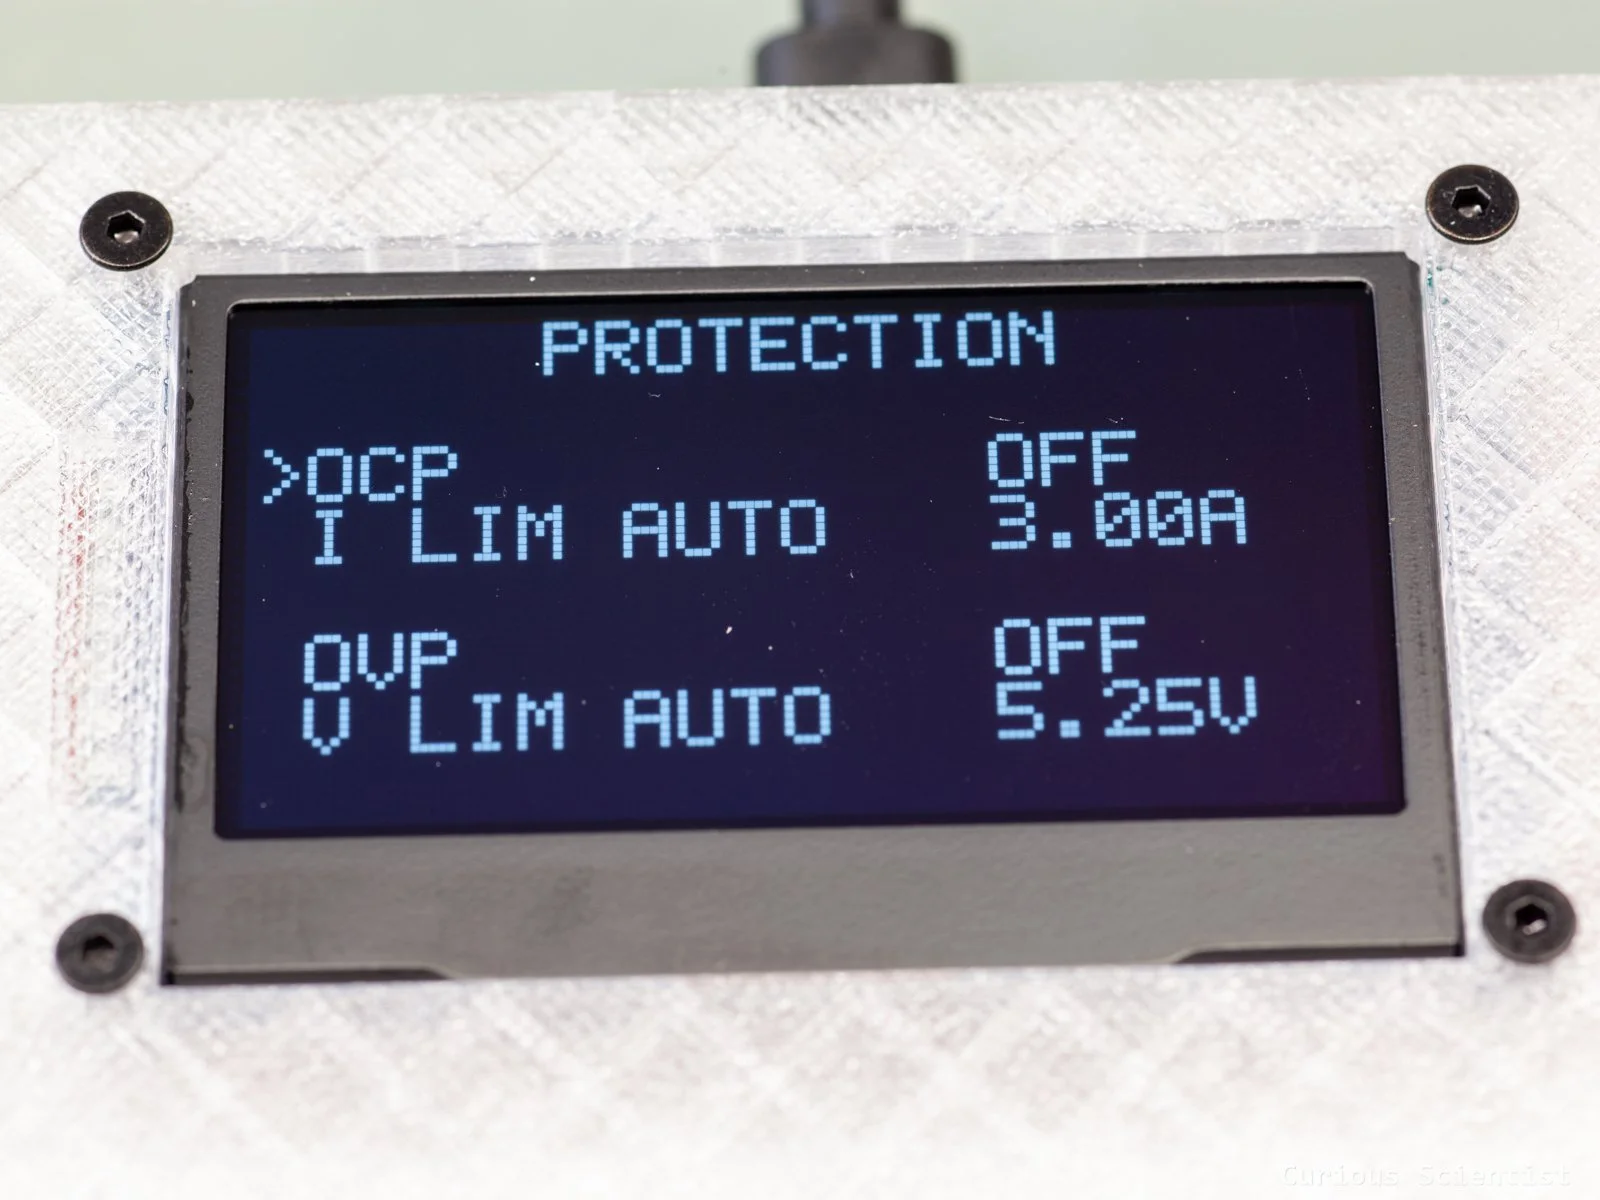
This page is dedicated to setting up overcurrent (OCP) and overvoltage (OVP) protection. By default, both protections are OFF. When the protection is disabled, the thresholds are calculated from the actual operating points. For current, it becomes the maximum current of the power adapter, and for voltage it becomes the negotiated voltage, plus 5% (e.g. 5.25 V for 5 V). But once the protection is enabled, the threshold becomes user-controlled.
Every roughly 5 ms (4 average, 528 us bus conversion and 528 us shunt conversion), the INA226 performs a measurement, and every roughly 11 ms (i2c communication throughput) the microcontroller fetches the most recent measurement results. Then, the logic is set up so it takes three consecutive threshold violations to trip the circuit. So, actually, the total response time from the first confirmed violation to shutting down the LM73100 is about 22 ms. Maybe too slow, maybe enough, but it is better than nothing. But, I wanted to activate the tripping on more than just one event because there can be noisy readings and such that could trick the device into thinking that there is an OV or OC event.
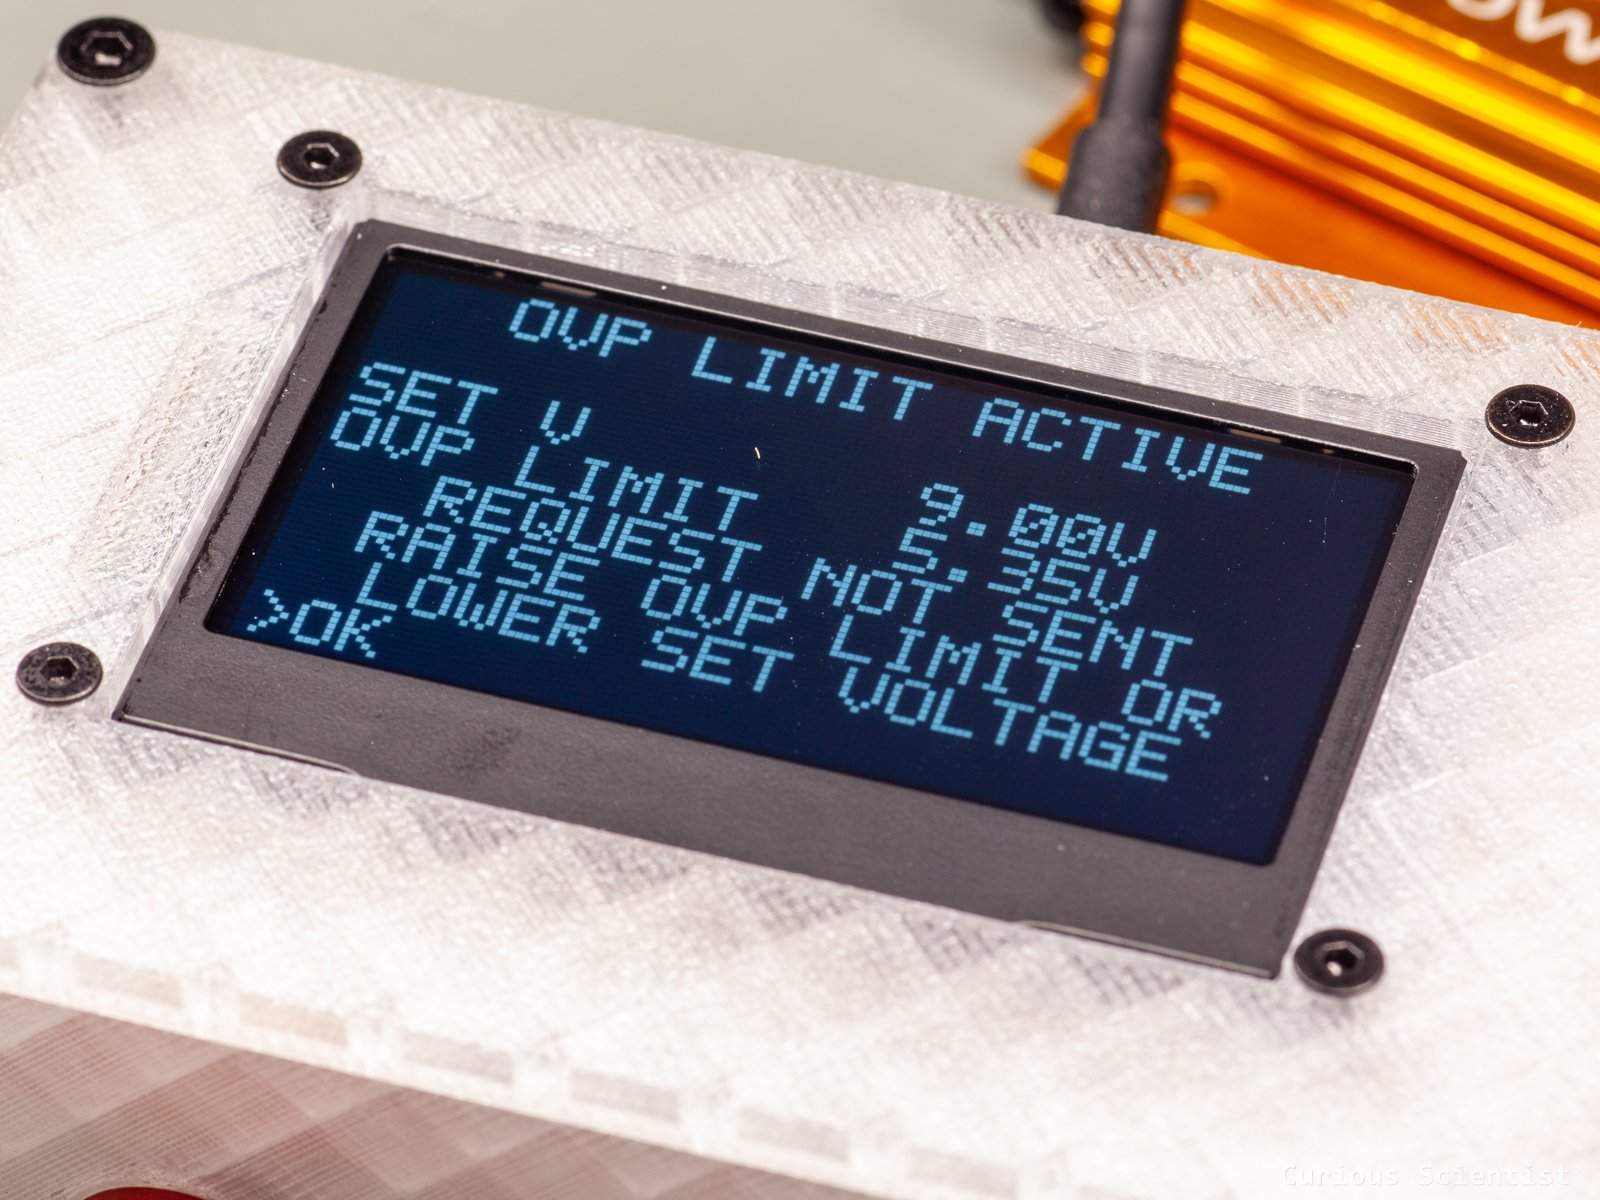
When the OCP or the OVP values are user-defined, they can be set to any values. If the output is enabled and the user modifies the threshold, the thresholds only get applied when the user exits edit mode. It can happen that, for example, the operating voltage is set to 9 V, and the user decreases the OVP threshold below this level. During editing, nothing happens, but when the user exits edit mode, the OVP will be tripped.
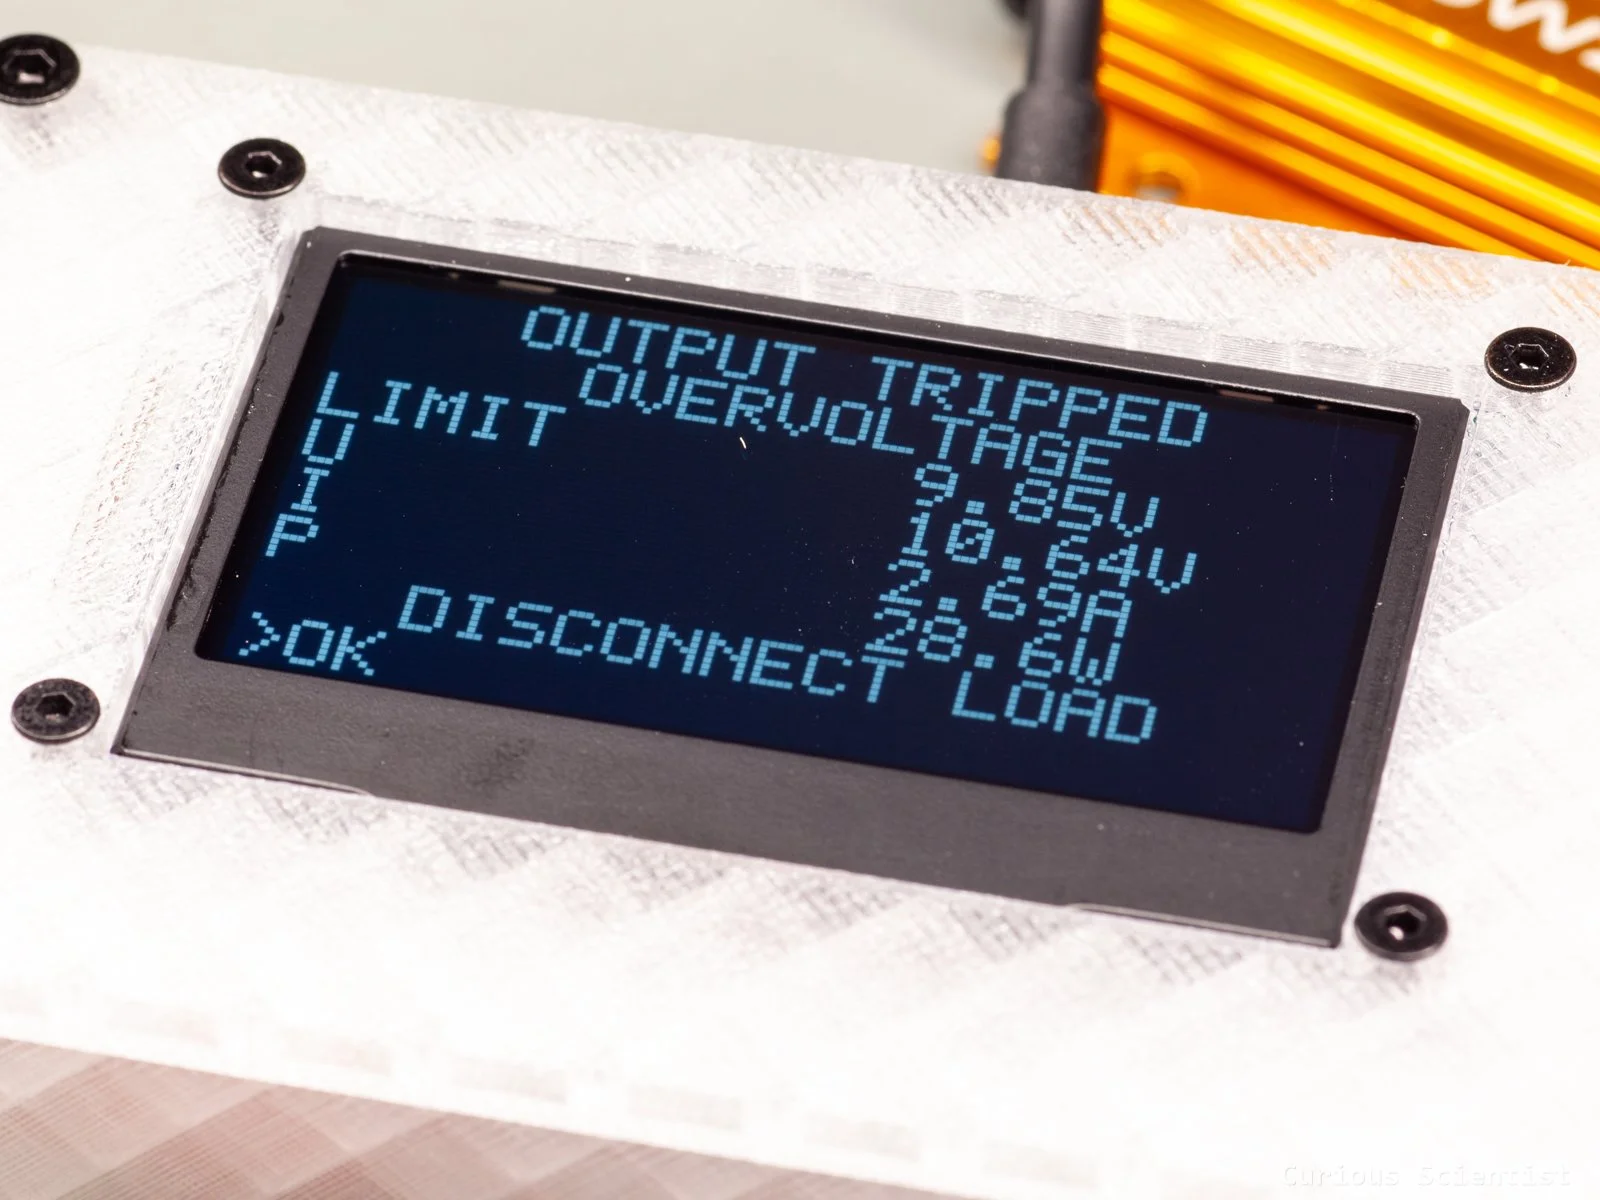
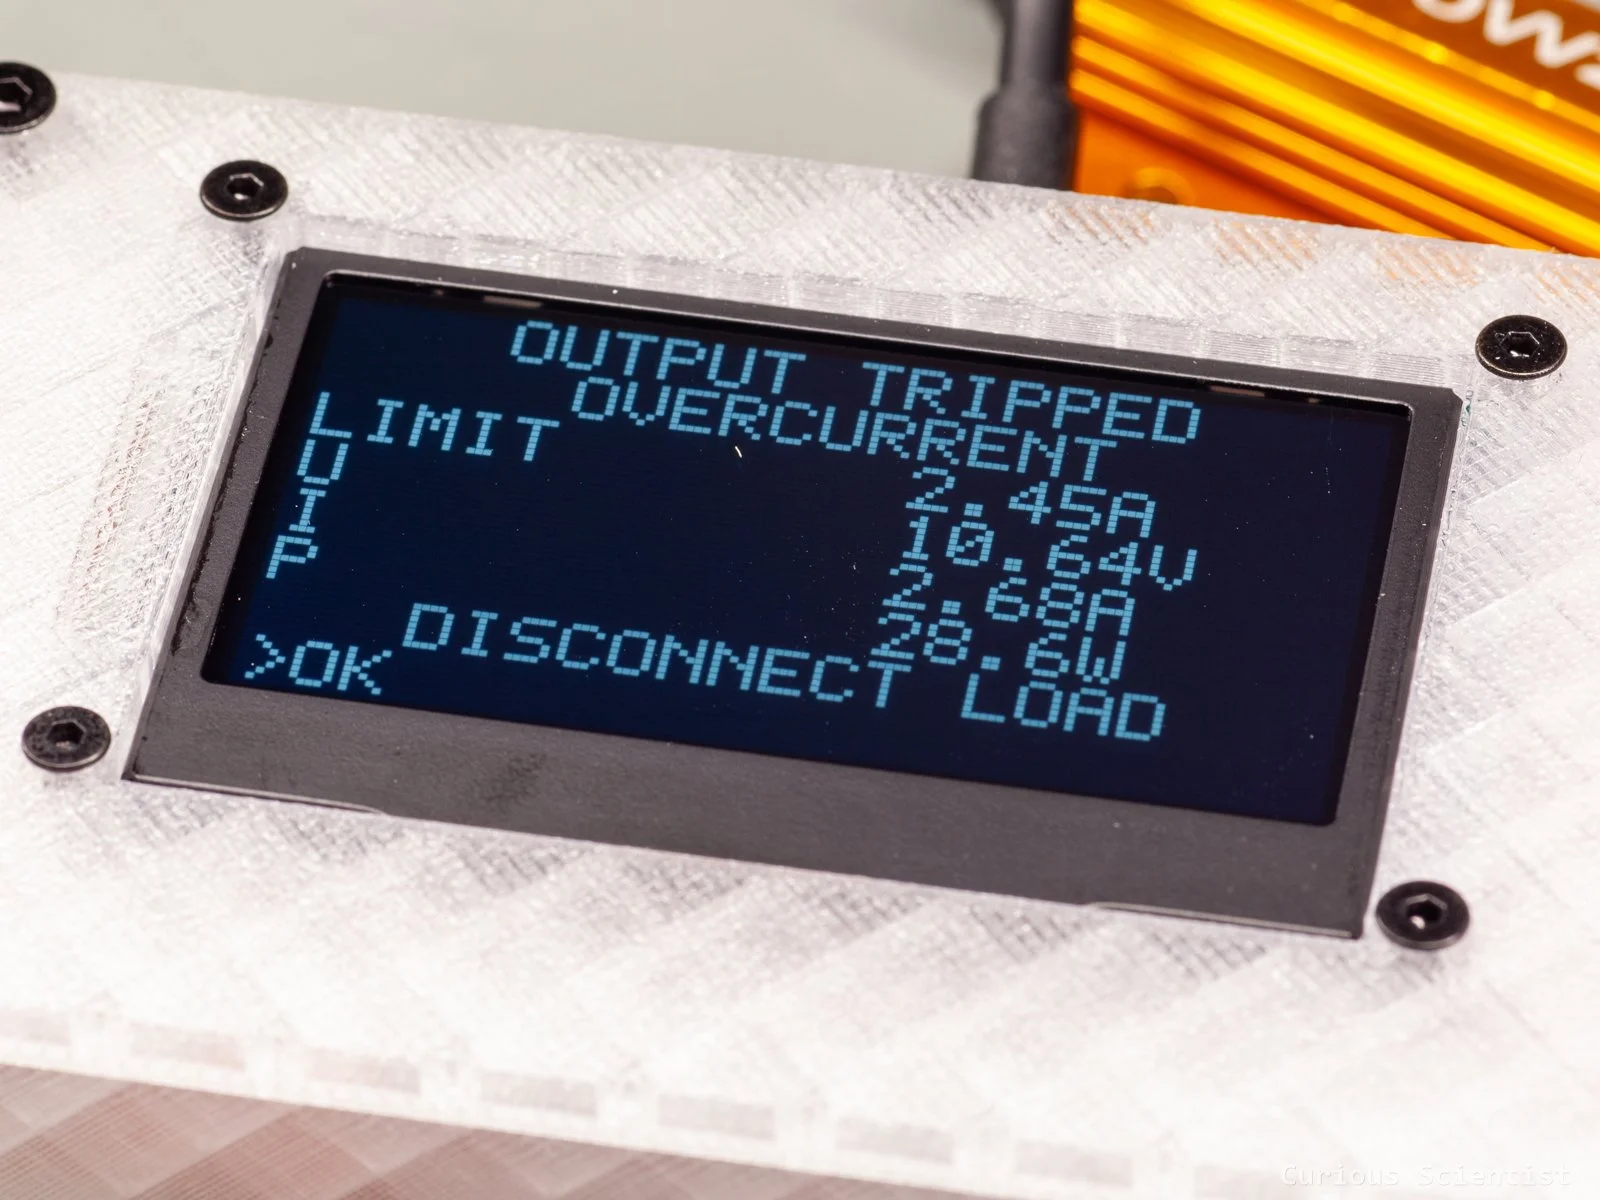
Whether OVP or OCP is tripped, the device prints an error message telling which condition was exceeded and what the latest parameters (I, U and P) were at the moment of tripping.
Furthermore, when OVP is enabled, and it is, let’s say set to 9.25 V, the user can not request voltages above this value because that would automatically cause tripping. If the user still tries to apply an illegal value, the request gets rejected, and a warning message will appear.
It is worth noticing that when a protection trip happens, the device just shuts the power off by turning the ideal diode off. So, for example, the USB-PD request is not changed by the trip. If the adapter was negotiated at 12 V when the OCP occurs, the request stays at 12 V, but the ideal diode is turned off. When the circuit is tripped, the protection becomes latched. Once the user confirms the warning message, the device returns to the main display and the diode stays off, so there’s no power being fed to the output.
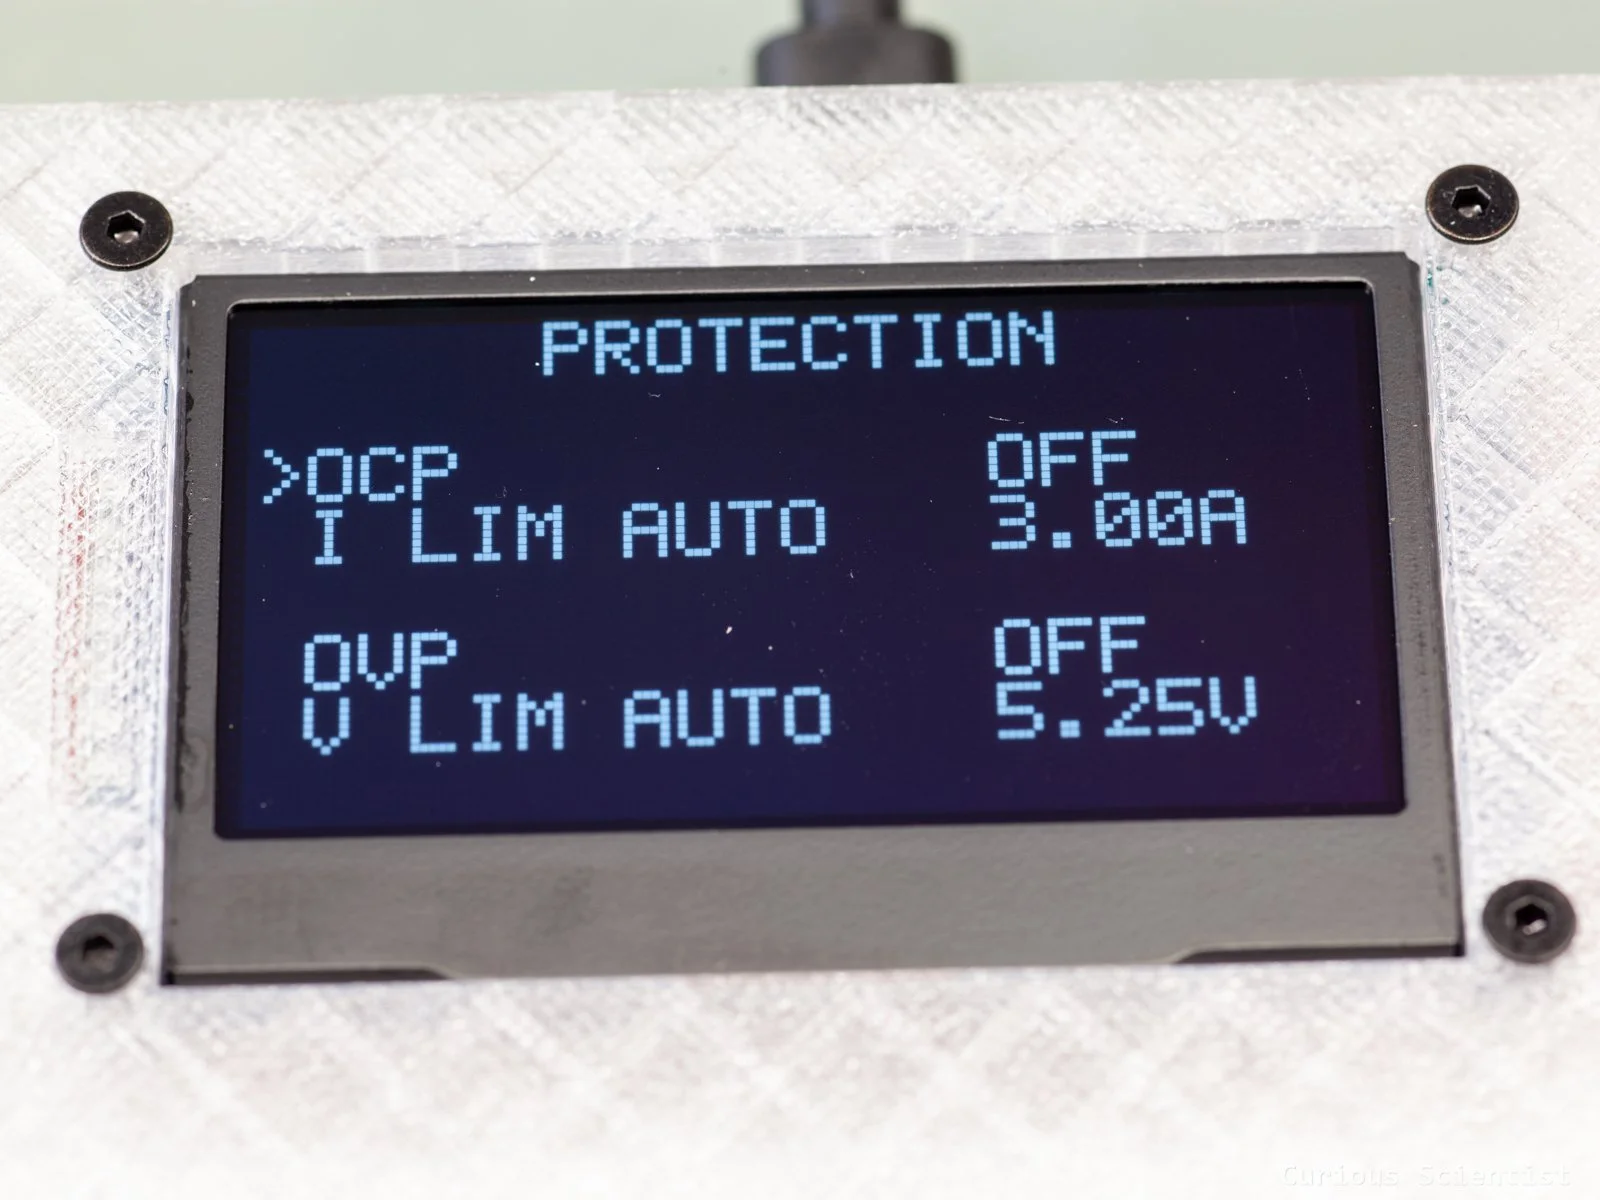
OVP and OCP protection page
Graphs - Voltage, current and power
The next three pages are dedicated to graphs: voltage, current and power. Each chart holds approximately 2 minutes of data. Since the display is 128 pixels wide and we plot a pixel each second, we have nearly 128 data points on the chart. Not exactly 128, because the graph has a Y-axis which also uses some pixels. When the graph is full, the line is erased, and the next point is printed at the beginning of the X-axis again. So, the device prints a new graph every two minutes. The data points for the graphs are collected and stored continuously in a circular buffer. Even when the graphs are not shown, their data is continuously kept updated and stored so when you reopen the chart, it just keeps going on.
Since there are only 64 vertical pixels and the top 13 pixels are occupied with the three values, the Y-axis is quite compressed. Therefore, for voltage, the full-scale range of 0-20 V is shown on the leftover 50 pixels. There is no autoscaling or anything because it would require sacrificing more space to print the scales and such on the Y-axis. So, the charts are more for just “visual entertainment” and quick information. If you want proper peaks and capture transitions, get an oscilloscope for the task.
Similarly to the voltage chart, the current and power charts also show full scale. So, the current graph is 0-5 A, and the power graph is 0-100 W. Considering that the power range is 0-100 W and it is printed on 50 pixels, we can quickly see each pixel represents about 2 Watts. So, the display does not really provide a high-resolution graph, especially when we consider how well the actual power meter can resolve the measured values. Again, the graphs are for visual representation.
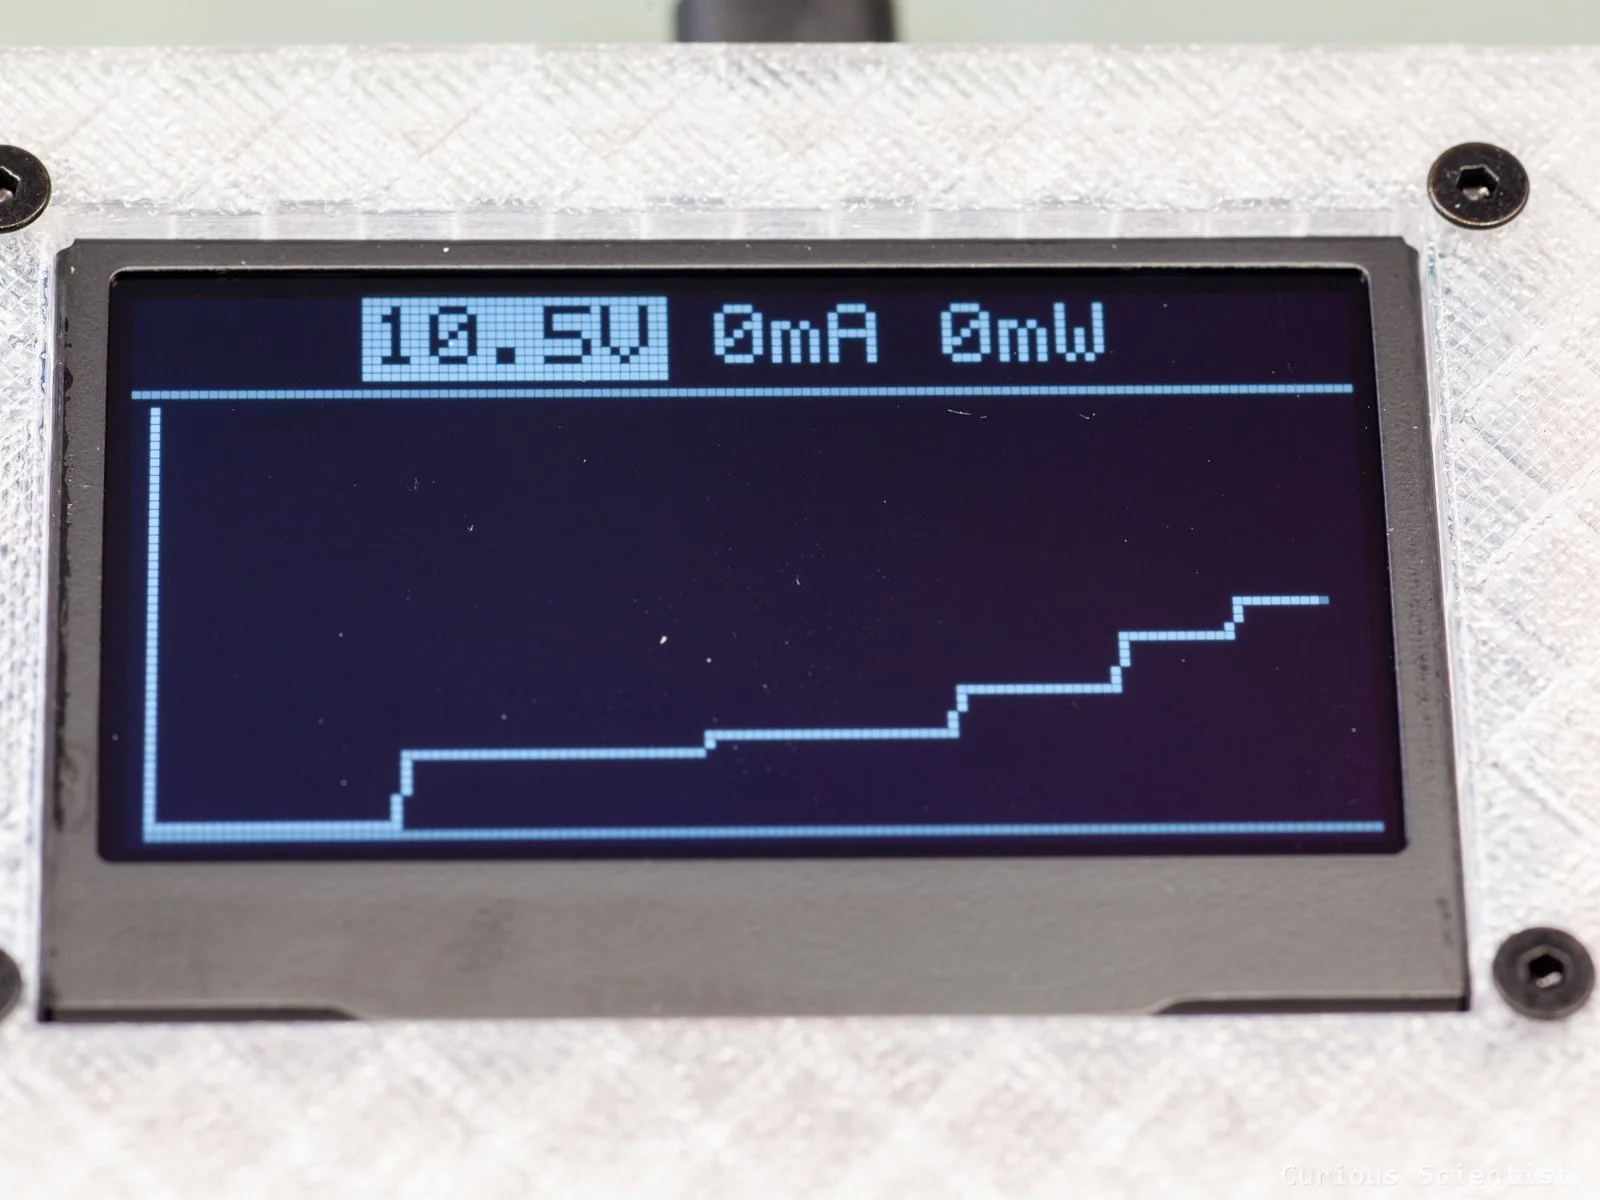
Voltage graph. It shows a gradually increased voltage.
Source capabilities
This page is simple, but it packs a lot of information. It lists all the capabilities of the connected USB adapter.
The lines marked with “Fx” are the fixed PDOs. Both the voltages and currents are shown for each PDO.
Then, in the line marked with P1, the device shows the PPS capabilities. This line shows the PPS voltage range and maximum achievable current. While the fixed PDO voltages are essentially the same (5V, 9V, 12V, 15V, 20V) for most of the adapters and only their current sourcing capabilities differ, the PPS voltage ranges can be very different. I saw power supplies with 3.3-11 V range, 5-16 V and so on…
Although I should notice that there can be differences in PDO capabilities, too! There are power supplies that, for example, don't support the whole 5 to 20 Volts
range, and/or don't have PPS at all.
The last line shows the absolute highest rating of the power adapter, which is based on the last fixed PDO value (highest voltage and current).
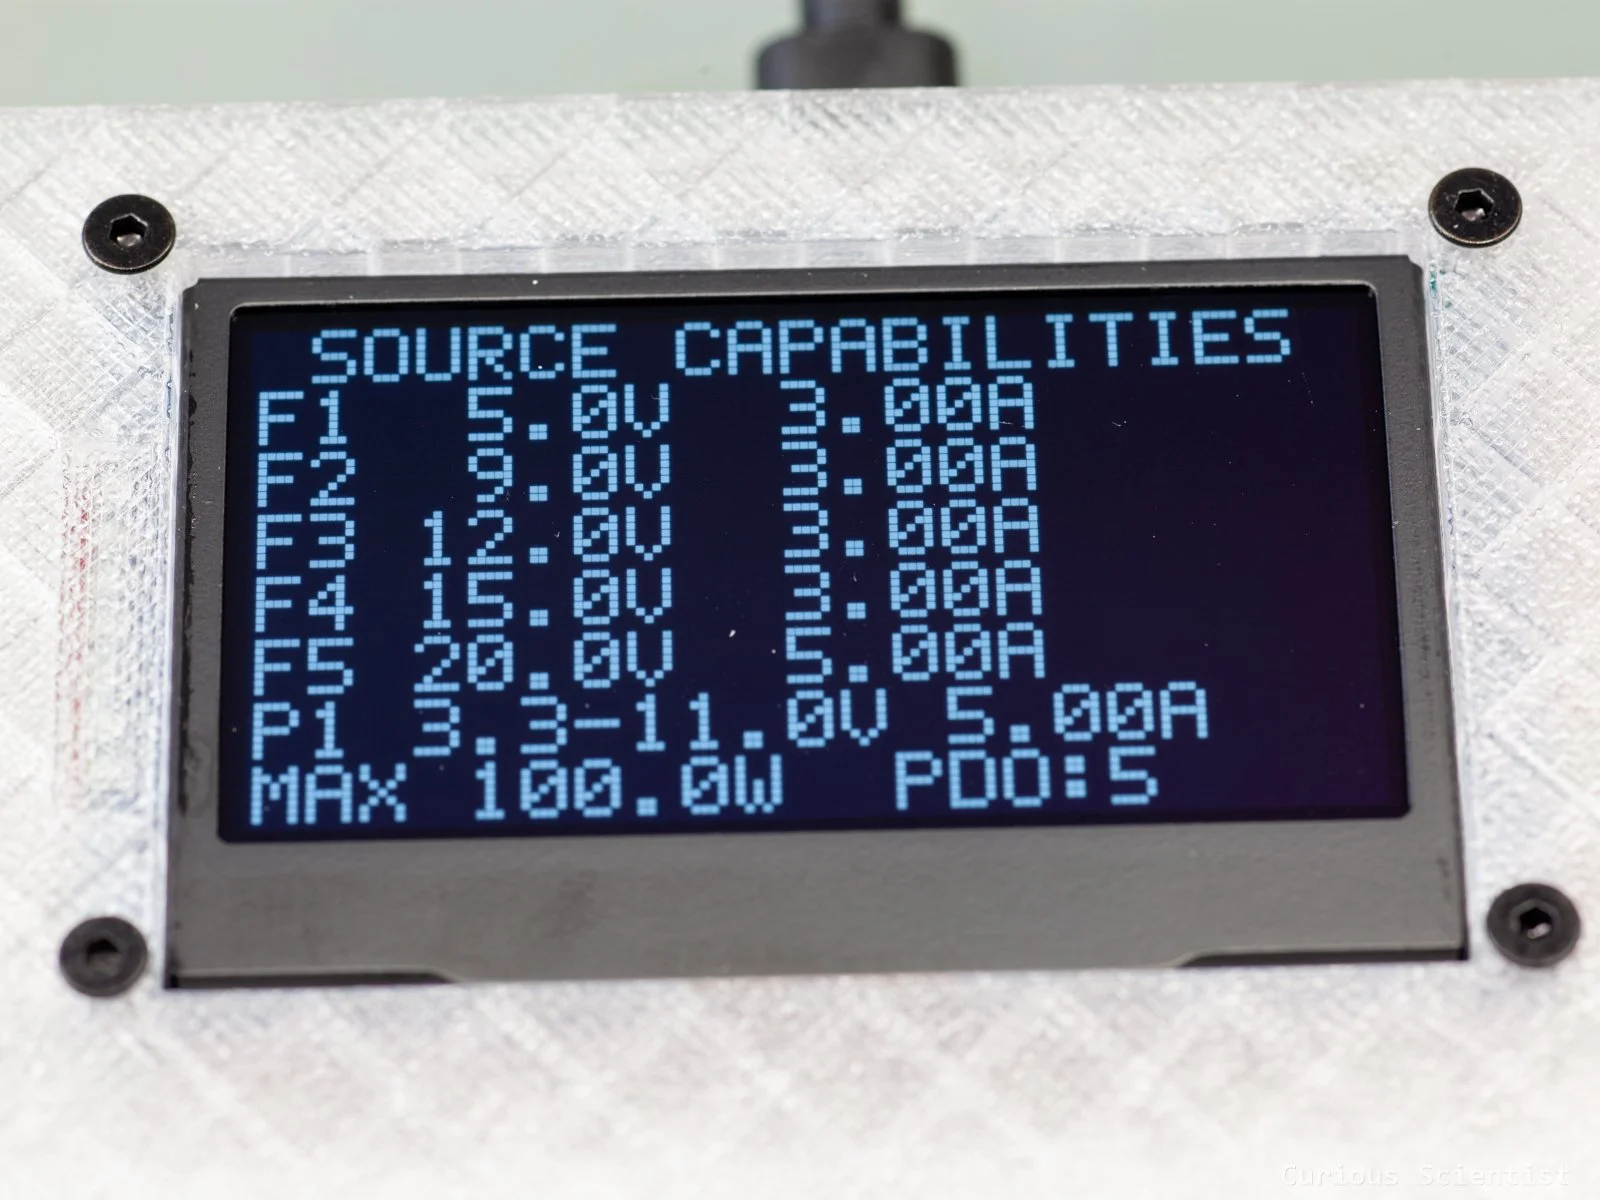
Sourcing capabilities of an Anker 317 power adapter
Session information
The session information page, as its name suggests, tracks the information of the actual session. It tracks elapsed time, energy, charge, and maximum voltage, current and power during the session.
A session is started from the moment the user enables the output (turns the ideal diode ON). Then, if the power is turned off, the session is just paused, not stopped. A session keeps accumulating the data until it is restarted. Therefore, this page has a dedicated reset button that sets all the accumulated values to zero, and when the user enables power again, the data is collected from scratch.
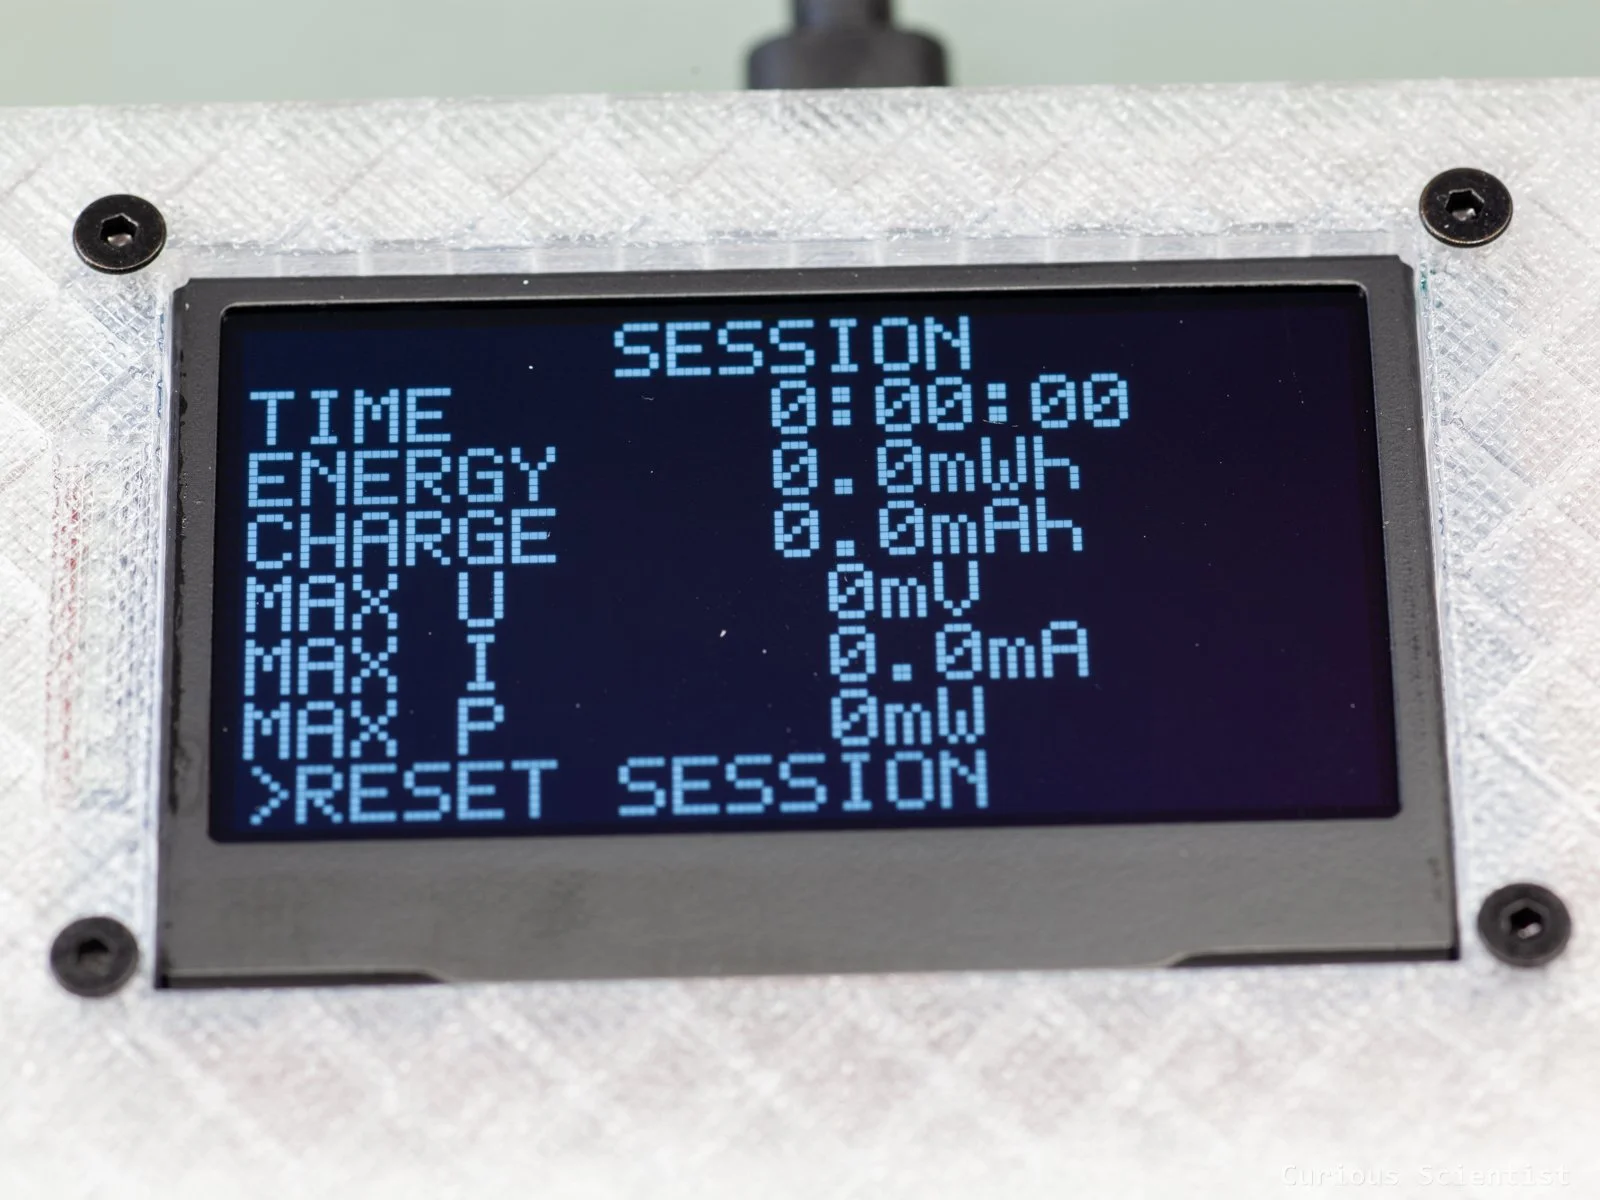
Session stats with optional reset function
Configuration
This page allows the user to adjust a few useful parameters. One can edit the step size values for voltage and current adjustment. This is particularly useful when using the PPS mode. It can be annoying to rotate the encoder several hundred times to get the PPS voltage up from 3.3 V to 9.62 V using 20 mV steps. So, the user can change this step size to 100, 500 and 1000 mV. The current step size is a bit more conservative because we have a smaller range to cover: 50, 100, 200 and 500 mA.
Finally, there is a possibility to change the brightness (contrast value) of the display. By default, the device boots with 60% brightness, but the user can select 20, 40, 60, 80 and 100% brightness.
All these values and selections vanish upon power cycling the device, and the step sizes default to 20 mV and 50 mA, and the brightness defaults to 60%. I was thinking about saving these parameters in the flash and recalling them upon booting, but it is so quick to modify these values, and each session can be used for different purposes where different step sizes are needed, so I just let them reset every time.
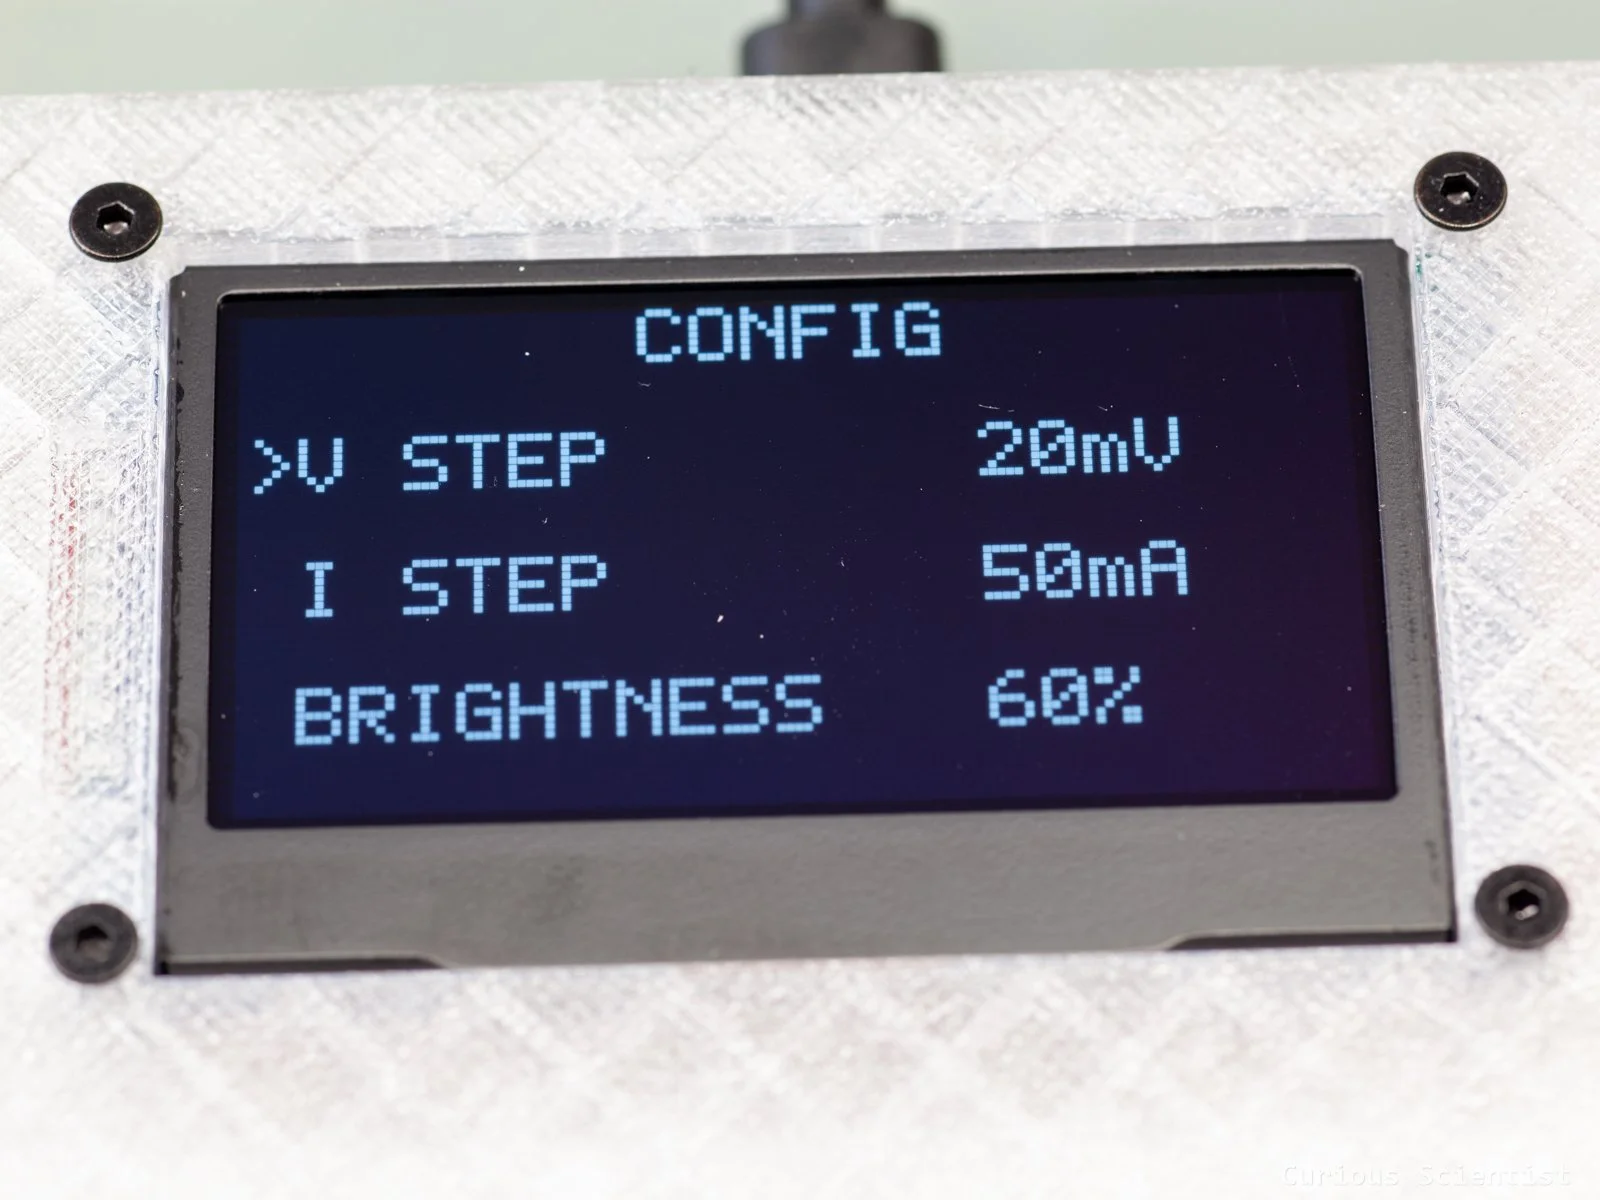
Adjustable voltage and current step sizes and adjustable brightness
Testing
To prove that my device is fully operational, I carefully tested it. It was both a good test for the hardware and for the software. Once again, I want to thank the generous people who made it possible for me to buy a 100 W power adapter. With this adapter, I could fully test the PCBs and the software’s capabilities.
I mostly focused on the software protection and its testing. I picked up an 8 Ohm 25 W power resistor and used it as a dummy load. This allowed me to test different scenarios.
First, I must mention that when the resistor is connected via the cables, and so on, there is a voltage sag. In this case, instead of the nominal 5 V, I saw 4.91 V on the output. At 9 V, the output became 8.9 V.
So, the first test I performed was at 9 V. I knew that the current would be around 1.1 A, and because of the sagging, the voltage would be below 8.95 V, so I set the thresholds to these values. Enabling the output did nothing strange; the device was running fine. Then, I yanked out the positive terminal. This disconnected the load, which also made the voltage sag disappear and pushed the output voltage up to 9 V. The protection immediately kicked in and shut off the power while also printing a warning message. So, the OVP worked! Just to test things, I tried to re-enable the output but as soon as I pressed the button, the protection kicked in and hindered me from enabling the output.
Then, I tried to trigger the overcurrent protection. I did this while the power was enabled. I edited the current limit below the actual current and tried to apply the setting. Once I exited edit mode, the device immediately tripped and printed a warning message and disabled the power. Maybe I could have programmed this behaviour differently, so when there’s power enabled, the user should not be able to apply a current limit below the actual current flowing through the circuit. But it is just an extra complication because ideally the current limit should be set before the power is enabled anyway.
I also repeated the same exercise with the voltage. While the power was enabled, I deliberately decreased the threshold below the actual output voltage. When I exited edit mode, the device tripped and shut off the power output.
Then, I tested another fun thing. I set the voltage limit to 9 V while the power was disabled, and the negotiated voltage was 9 V. This is so far fine. But then I tried to change the negotiated voltage to 12 V. This triggered another warning message. I implemented a behaviour that does not let the user request higher voltages than the voltage limit. This is especially dangerous when a new voltage is requested while the circuit is on. As I mentioned earlier, it takes a few tens of milliseconds for the protection to kick in. Maybe that is enough to fry the connected circuit. Therefore, to decrease the chances, I added this block.
I also tested the power adapter’s built-in current limit. With the 8 Ohm resistor connected, I slowly started to increase the voltage in PPS mode, while keeping the “negotiated” current at 1 A. Once I started to negotiate high enough voltage, a large difference was noticeable between the negotiated and the actual output voltage. This is because the power adapter throttled down the actual PPS output voltage to keep the 1 A current limit. Even at 11 V requested voltage, the output voltage was still stuck at ~8.75 V, and the current was still 1 A. So, I set the negotiated current to 2 A, and the output voltage immediately jumped to 10.87 V and the current to 1.36 A. So, the power adapter’s current limiting feature also worked.
I tried to go below 1 A, but this was not possible. This is due to the iPpsCLMin parameter defining the charger's minimum programmable current limit mode threshold. Theoretically, what I was doing was invalid because, despite the fact that the circuit could send a lower-than-1-A request, the adapter neglected it and kept the minimum limit as 1 A.
I then connected two 2 Ohm 100 W resistors in series. Nominally 4 Ohms (I measured 4.4 Ohms), so at 20 V, we could expect 5 A. Of course, there is the contact resistance of the terminals and clips, and the resistance of the wires, so the overall resistance will be somewhat higher, plus there will be some voltage sagging.
In my setup, I could achieve 18.66 V output voltage and 4.67 A current.
But this did not work by simply turning on the output (enabling the diode) at the 20 V requested voltage. Not even at 12 V. I suspect that the inrush current was too large and the power adapter refused to provide power. So, I had to go slowly and gradually increase the voltage to larger and larger values. But I also experienced an interesting (but somewhat expected) behaviour while going up gradually towards 20 V. The power supply, as we could see its capabilities, can provide 3 A at each PDO level, except at 20 V where it can go up to 5 A. Well, at 15 V, my resistor setup would draw current above 3 A. So, when I switched from 12 V to 15 V negotiated voltage, the device accepted it, and at the next moment, it restarted, which I think was due to the momentary power cut-off by the power adapter.
So in the next ramp-up, I skipped 15 V and jumped to 20 V after 12 V. The device successfully requested 20 V from the power adapter, and the output reached 18.66 V and 4.69 A. Not quite 20 V and 5 A, but we know why. Anyway, nearly 100 W was coming out from the device and going through the resistors, and I definitely felt the radiating heat. I measured the surface temperature of the resistors with a thermocouple, and I measured temperatures over 80°C. Toasty!
I also did some “non-electrical” tests, or more like comparisons between the visibility of the OLED and the TFT LCD display. It does not need too much explanation; just look at the pictures and the video footage. The OLED is significantly better in brightness and contrast. I even “cheated” to improve the LCD’s image by turning off the overhead light and blocking the reflections, but the OLED was just much, much better. By the way, it was not even at 100%, but at 60% brightness. For me, OLED wins, even though a colored display might be fancier. Maybe an IPS LCD could work better, but I think I'll settle on the design with the OLED display.
For my YouTube channel members, the firmware is available in a compiled format for both displays. I recommend going with the OLED display because the display is much better, and the firmware is also better. The LCD version does not have software protection or session statistics implemented.
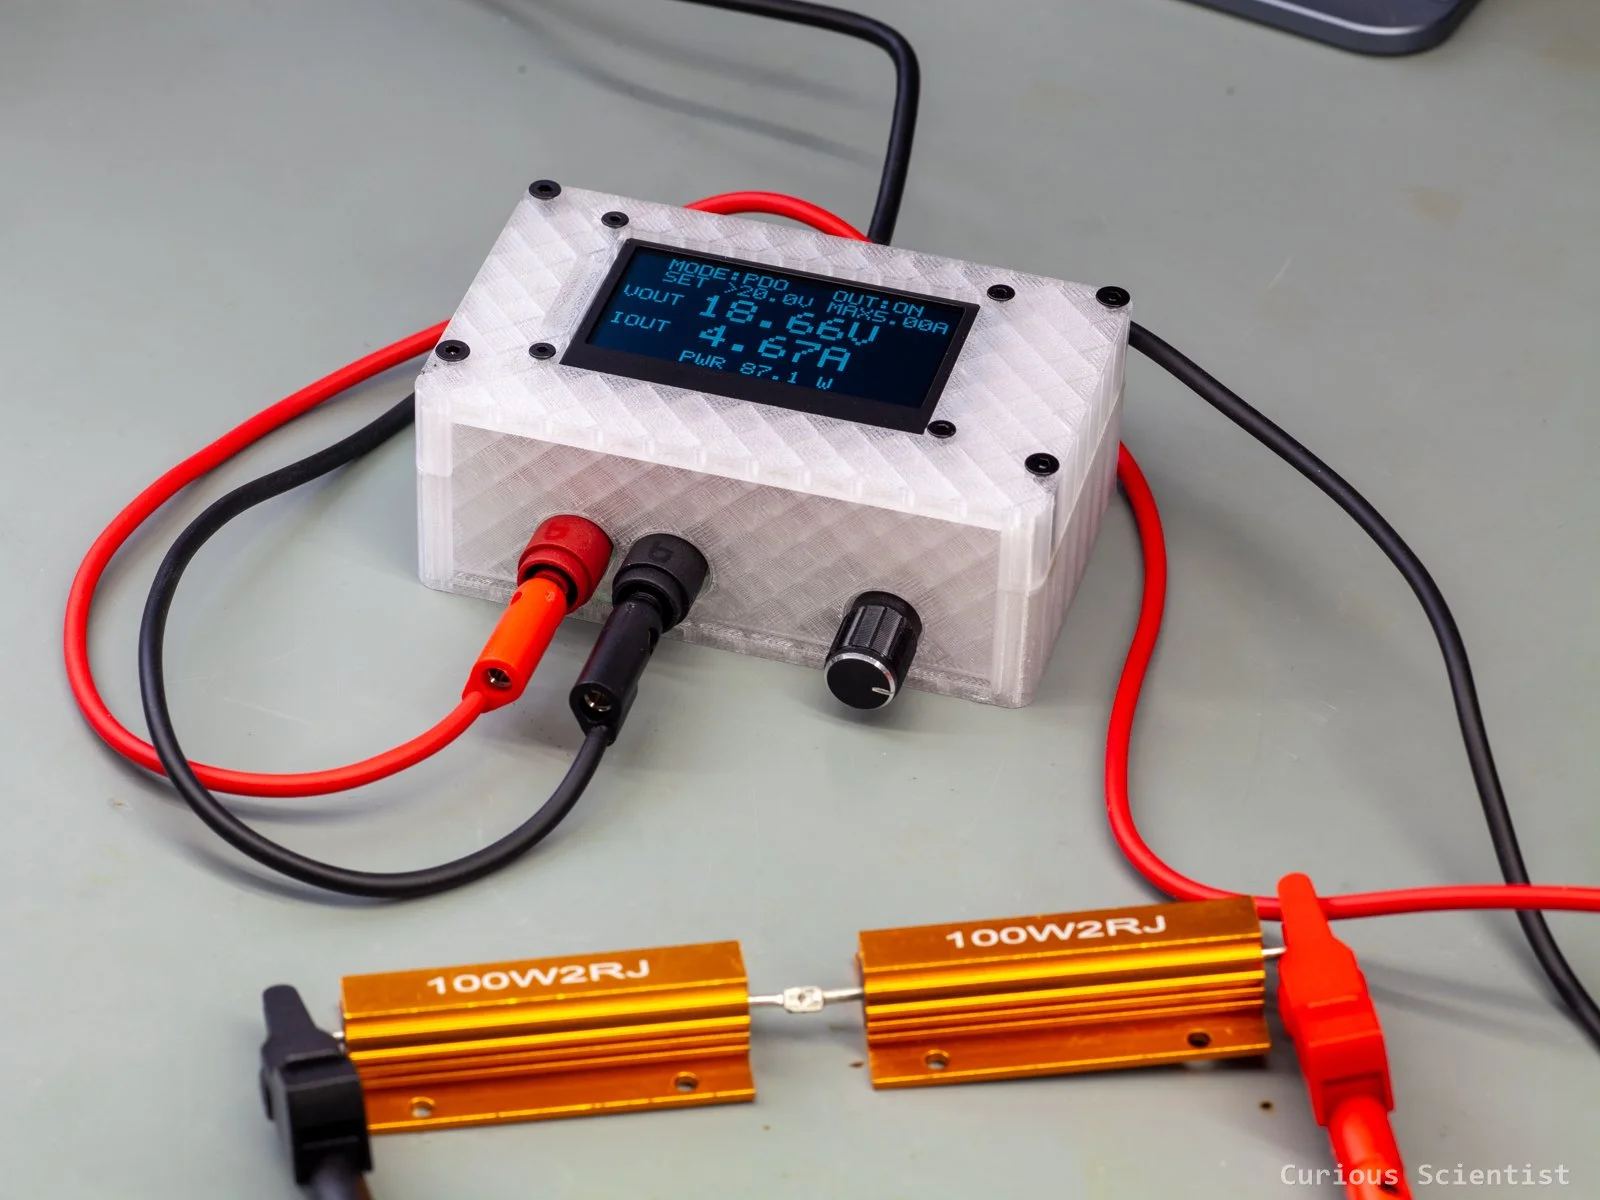
A roughly 4 Ohm (4.4 Ohm, measured) load connected to the device while the output was set to 20 V and 5 A.
Get the PCB and the 3D printable enclosure via my PCBWay project page