TCD1304-based spectrometer - Part 4
In this video, I show you a few updates regarding my spectrometer project. In the previous videos I already presented the working instrument, and in this video I demonstrate some further adjustments and improvements.
Additional information
Compared to the previous iterations, the main update is that I made a “light source box”. Until now, I was directly shining light into the SMA terminal of the spectrometer enclosure. It worked relatively well, but it was unprofessional and only allowed me to use LEDs and lasers as light sources. I wanted to change this because I wanted to be able to analyse the spectrum of all kinds of light sources. Since the SMA port was already given, it was an obvious choice to use an optical fiber.
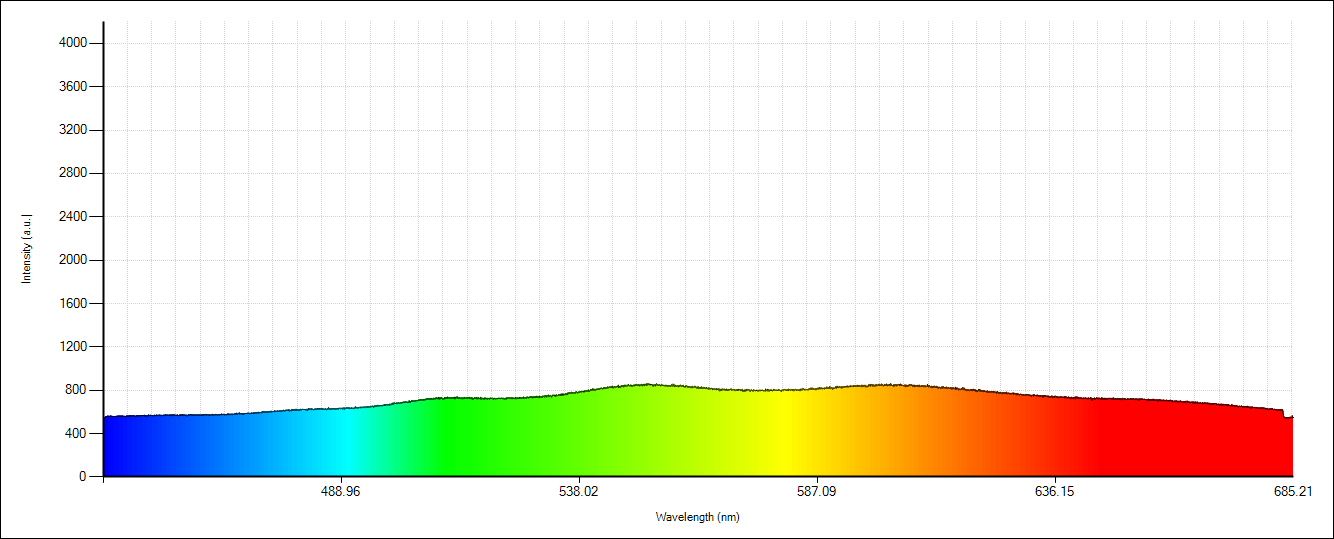
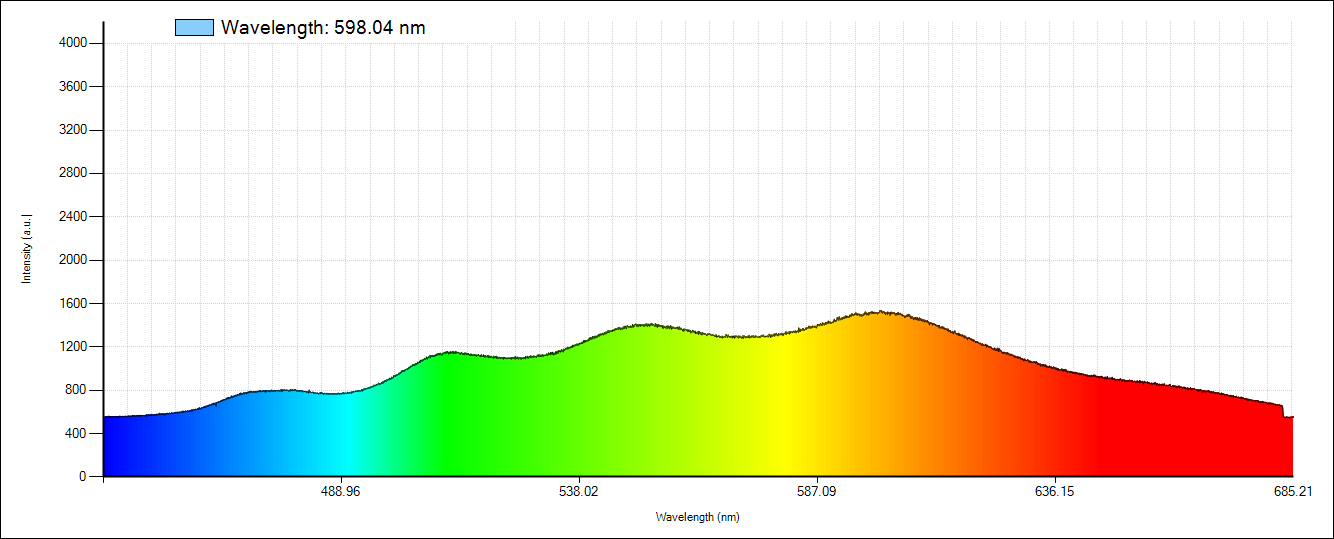
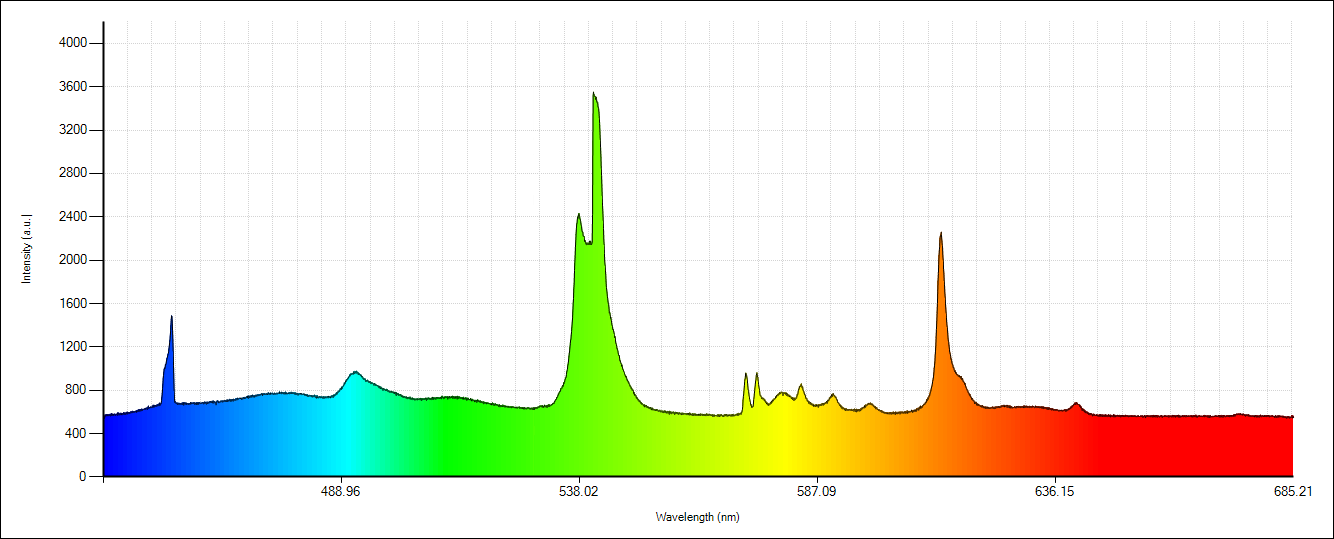
I bought an optical cable that has an SMA connector on one side (spectrometer side) and an FC connector on the other side (light source side). After getting the cable, I searched for an FC terminal that I could attach to the wall of an enclosure. I found an FC D-shape terminal on eBay and luckily enough, it was constructed in a way that I could screw it apart into two identical pieces. So I actually bought 2 connectors. :) However, as it turned out during the experimentation, the fiber optics was not behaving very well. The issue was that part of the spectrum was missing, depending on the position of the fiber optics in the SMA connector. When it was properly inserted and fixed, the top part of the spectrum, roughly above 580 nm, was missing or was very weak. If I slightly pulled the cable out from the connector, the bottom part of the spectrum started to disappear and the peaks above roughly 580 nm started to appear. I am not an expert in fiber optics, but my suspicion is that the core diameter (100 um) is too small, so the light coming through it is not projected properly on the entrance slit of the spectrometer and on the rest of the elements. As of now, this is only a speculation. I will try to get a fiber optic cable with a larger core diameter and see if it improves the spectrum.
The metal box is cylindrical, its inner diameter is 10.5 cm and its inner height is 28 cm. With the E27 socket, the maximum length of the light source is about 22 cm.
First, I cut a 36 mm diameter hole in the lid of the metal box. This allowed me to fix the E27 socket in it, so I could change a light source very conveniently. Then, I cut the holes for the FC connectors at the bottom of the metal box and on the side of the metal box. I did not use any focusing optics (lenses) to project the light of the source into the optical fiber. My assumption was that the amount of light coming from the bulb should be enough for my hobby purposes. I can always use longer exposure times to increase the signal intensity.
Another addition related to the light sources is that I finally was able to purchase a proper ballast (Philips HID-PV C 70 /S CDM 220-240V 50/60Hz). This ballast allows me to use different fancy light sources such as a sodium discharge lamp.
I bought the following light sources for testing:
Philips SON-T PIA Plus: high-pressure sodium lamp,
Philips Genie Esaver: fluorescent lamp,
Osram Parathom Retrofit Classic: LED lamp.
Calibration
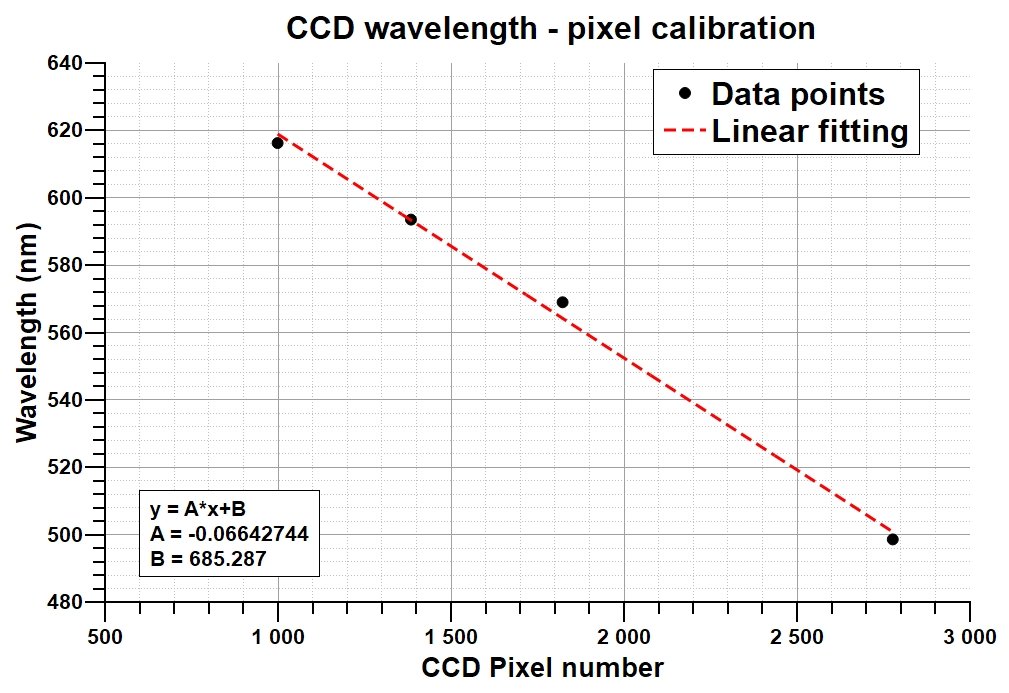
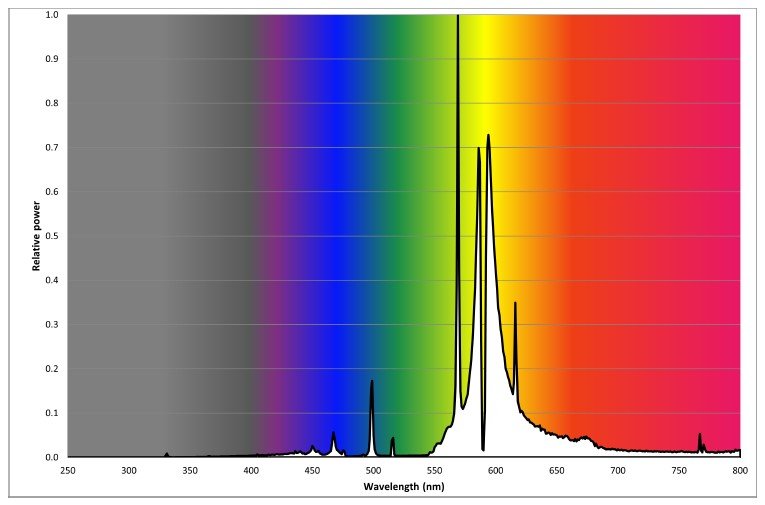
First, let’s quickly discuss the calibration. In the new version of my spectrometer software, there are 4 calibration points which means that 4 pixel position - wavelength values can be provided for the linear regression calculation. I used the spectrum of the high-pressure sodium lamp for calibration.
First, I saved a picture of the spectrum recorded by the manufacturer. Then, I imported the picture into Webplotdigitizer and then by calibrating the graph, I read the values of a few peaks.
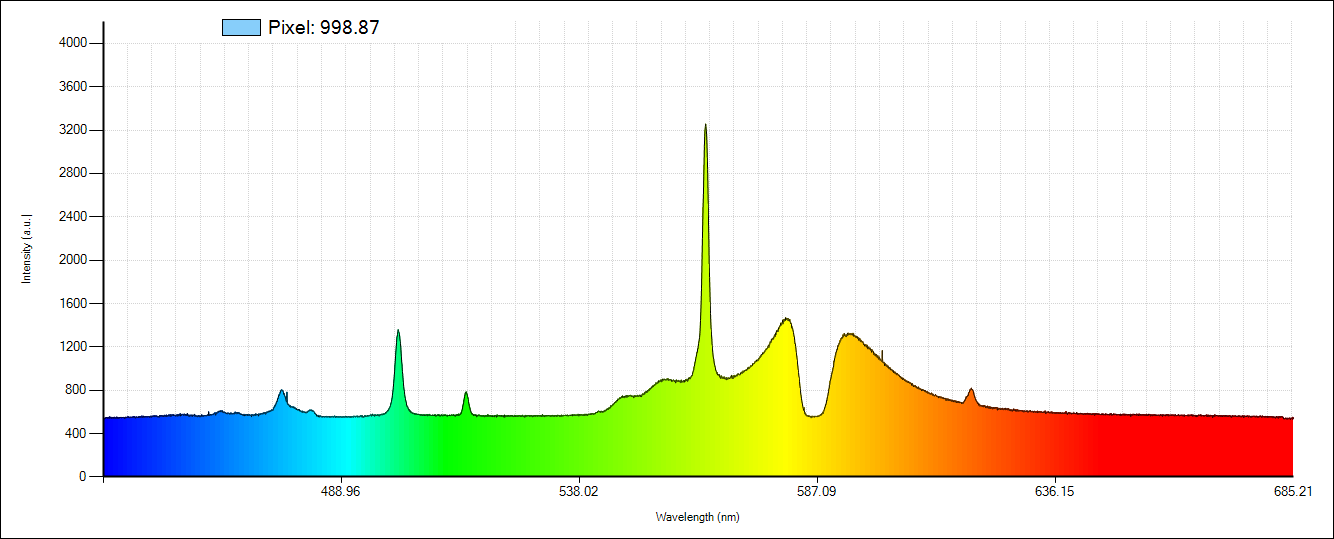
Then, I opened my software and read the pixel positions of the peaks that I identified on the manufacturer-provided spectrum. This provided me with the necessary pixel position - wavelength pairs. I entered the values in the software, and then with the help of the Math.NET Numerics library I fitted a linear curve on the dataset.
The fitting returned with the A and B parameters of an y = A*X+B type linear equation. Using the A and B fitting parameters and substituting X as the CCD pixel number, the X-axis can be transformed into wavelength in nanometres. Further measurements then were done using a similar fitting.
Results and further information
Below you can see some relevant links as well as a gallery with the recorded spectra. In the future, I will mainly focus on two things. First of all, I will try to solve the issues with the optical fiber. I think that this issues is just a matter of cable selection and with a better cable, I can solve the erratic behaviour of the system. Second, I will further look into the calibration of the CCD. I will try to get rid of the issue that causes the edges of the spectrum to have a lot of error. I will need some better light sources that can provide peaks between 440 nm to 690 nm. A mercury lamp would be an ideal solution, but it cost a lot and the YouTube videos are not that profitable…
Get the relevant parts using my affiliate links
Join my YouTube membership!
Get the TCD1304 Linear CCD PCB from PCBWay!